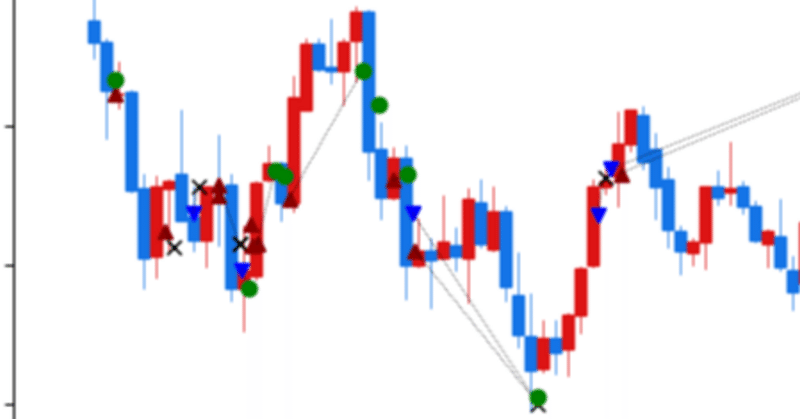
チャート上に約定履歴を表示するツールVer2(DMM FX用)

一部の業者さんでは実装されている、チャート上に約定履歴を表示するツールを作成しました。詳細は以前の記事を参照してください。
https://note.com/azk_azukisan/n/n90794f446627
前バージョンとの違い
描画する時間を選択できるようになりました。
丸一日を描画すると値幅の関係でスクロールが困難だったり重かったりしたので、範囲を狭めることで動作が軽くなるようになっています。
※5分、15分足は選択できなくなりました。
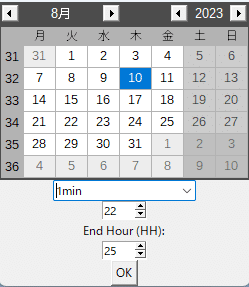
OKを押すと、チャートが描画されます。
以下コード。
エディタにコピペして.pyで保存してください。
import pandas as pd
import os
import matplotlib.pyplot as plt
import matplotlib.dates as mdates
from mpl_finance import candlestick_ohlc
import tkinter as tk
from datetime import time
from tkcalendar import Calendar
from datetime import datetime, timedelta
from tkinter import ttk
import sys

# V24 ファイルパスの設定を変更

# スクリプトがEXEとして実行されているかどうかを判定
if getattr(sys, 'frozen', False):
    # EXEとして実行されている場合
    application_path = os.path.dirname(sys.executable)
else:
    # スクリプトとして実行されている場合
    application_path = os.path.dirname(os.path.abspath(__file__))

# データファイルとトレード履歴ディレクトリのパスを設定
data_path = os.path.join(application_path, 'USDJPY_M1.csv')
trade_history_dir_path = os.path.join(application_path, 'Trade_History')


def load_trade_data(directory):
    # List all csv files in the directory
    files = [f for f in os.listdir(directory) if f.endswith('.csv')]

    # Load each csv file and append to a list of dataframes
    dfs = [pd.read_csv(os.path.join(directory, f), encoding='shift-jis') for f in files]

    # Concatenate all dataframes into one
    trade_data = pd.concat(dfs)

    # Convert '約定日時' to datetime and set as index
    trade_data['約定日時'] = pd.to_datetime(trade_data['約定日時'])
    trade_data.set_index('約定日時', inplace=True)

    return trade_data

def plot_ohlc_with_trades(ohlc_data, trade_data, start, end, width):
    # Ensure the data is sorted by datetime
    ohlc_data = ohlc_data.sort_index()
    trade_data = trade_data.sort_index()

    # Extract data for the given date range
    data_range = ohlc_data.loc[start:end]
    trade_range = trade_data.loc[start:end].copy()  # Make a copy of the slice

    # Prepare data for OHLC plot
    ohlc = data_range[['<OPEN>', '<HIGH>', '<LOW>', '<CLOSE>']].copy()
    ohlc.reset_index(inplace=True)
    ohlc['Datetime'] = ohlc['Datetime'].map(mdates.date2num)

    # Create plot
    fig, ax = plt.subplots(figsize=(12,6))

    # Plot OHLC data
    candlestick_ohlc(ax, ohlc.values, width=width, colorup='#DC1414', colordown='#1474E6')  # Adjusted RGB values

    # Convert '決済損益(円)' to numeric
    trade_range['決済損益(円)'] = trade_range['決済損益(円)'].str.replace('\\', '').str.replace(',', '').astype(float)  # Remove backslash and comma, then convert to float

    # Plot trades
    last_buy = None
    last_sell = None
    for idx, row in trade_range.iterrows():
        color = 'black'
        marker = 'o'
        if '新規' in row['区分']:
            if '買' in row['売買']:
                color = '#8B0000'  # dark red
                marker = '^'
                last_buy = (idx, row['約定レート'])
            elif '売' in row['売買']:
                color = '#0000FF'  # blue
                marker = 'v'
                last_sell = (idx, row['約定レート'])
        elif '決済' in row['区分']:
            if row['決済損益(円)'] >= 0:
                color = 'green'
            else:
                color = 'black'
                marker = 'x'
            if last_buy is not None:
                ax.plot([last_buy[0], idx], [last_buy[1], row['約定レート']], color='black', linestyle='dotted', linewidth=0.5)  # Adjusted linewidth
                last_buy = None
            if last_sell is not None:
                ax.plot([last_sell[0], idx], [last_sell[1], row['約定レート']], color='black', linestyle='dotted', linewidth=0.5)  # Adjusted linewidth
                last_sell = None
        ax.plot_date(idx, row['約定レート'], fmt=' ', color=color, marker=marker)  # Remove marker from fmt

    # Format x-axis
    ax.xaxis_date()
    ax.xaxis.set_major_formatter(mdates.DateFormatter('%Y-%m-%d %H:%M'))

    # Set plot title and labels
    ax.set_title('OHLC Chart with Trades (Japan Time)')
    ax.set_xlabel('Time')
    ax.set_ylabel('Price')

    # Rotate x-axis labels
    plt.setp(ax.get_xticklabels(), rotation=45)

    # Show plot
    plt.show()

# Load MT5 OHLC data
data_path = os.path.join(application_path, 'USDJPY_M1.csv')
data = pd.read_csv(data_path, delimiter='\t')  # Modify this line
data['Datetime'] = pd.to_datetime(data['<DATE>'] + ' ' + data['<TIME>'])
data['Datetime'] = data['Datetime'] + pd.Timedelta(hours=6)
data.set_index('Datetime', inplace=True)

# Load trade record data from all csv files in the specified directory
trade_history_dir_path = os.path.join(application_path, 'Trade_History')
trade_data = load_trade_data(trade_history_dir_path)  # Modify this line

# Create a root window
root = tk.Tk()

# Create a calendar and a button
cal = Calendar(root)
button = tk.Button(root, text="OK", command=root.quit)

# Create a combo box for time frame selection
time_frame = ttk.Combobox(root, values=['1min'])
time_frame.current(0)  # Set default value

# Pack the calendar, the combo box, and the button into the window
cal.pack()

time_frame.pack()

# Get the selected date and time frame
selected_date = cal.selection_get()
selected_time_frame = time_frame.get()

# Resample the data according to the selected time frame
if selected_time_frame == '5min':
    data = data.resample('5T').agg({
        '<OPEN>': 'first',
        '<HIGH>': 'max',
        '<LOW>': 'min',
        '<CLOSE>': 'last'
    })
    width = 0.003
elif selected_time_frame == '15min':
    data = data.resample('15T').agg({
        '<OPEN>': 'first',
        '<HIGH>': 'max',
        '<LOW>': 'min',
        '<CLOSE>': 'last'
    })
    width = 0.009
else:
    width = 0.0006  # For 1min


start_hour = tk.Spinbox(root, from_=0, to=23, width=5)
label_end_hour = tk.Label(root, text="End Hour (HH):")
end_hour = tk.Spinbox(root, from_=0, to=23, width=5)
start_hour.pack()
label_end_hour.pack()
end_hour.pack()
button.pack()

# Run the main loop
root.mainloop()

# Get the selected date and time frame
selected_date = cal.selection_get()
selected_start_hour = int(start_hour.get())
selected_end_hour = int(end_hour.get())
# Plot the data
start = datetime.combine(selected_date, time(hour=selected_start_hour))

if selected_end_hour > 23:
    selected_date += timedelta(days=1)
    selected_end_hour -= 24
end = datetime.combine(selected_date, time(hour=selected_end_hour))
width = 0.00060
plot_ohlc_with_trades(data, trade_data, start, end, width)
よければ良いねとRTをお願いします…!
コードに5分15分足を書く痕跡がありますが気にしないでください…。
この記事が気に入ったらサポートをしてみませんか?