チャート上に約定履歴を表示するツール(DMM FX用)

一部の業者さんでは実装されている、チャート上に約定履歴を表示するツールを作成しました。
使用するのに少し手順が必要です。
※基本的に無料の記事ですが、Pythonの準備が不要な.exe版だけ300円にしました。
※基本的にサポートはしません(メッセージに気がついた時に対応します)
必要なもの
●Pythonのインストールと追加のライブラリ
基本ライブラリ以外のインストールが必要です。
ウインドウズアイコンをクリックして、cmdと入力しコマンドプロンプトを起動。下の文字列をそのままコピペして実行してください。
pip install pandas matplotlib mpl_finance tkcalendar●DMM FXの約定履歴
新規・決済を含めた約定履歴。
100件づつしかダウンロードできないので頑張ってダウンロードしてください。
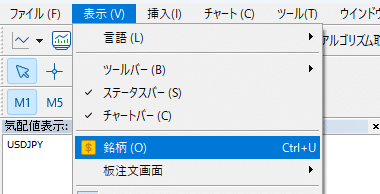
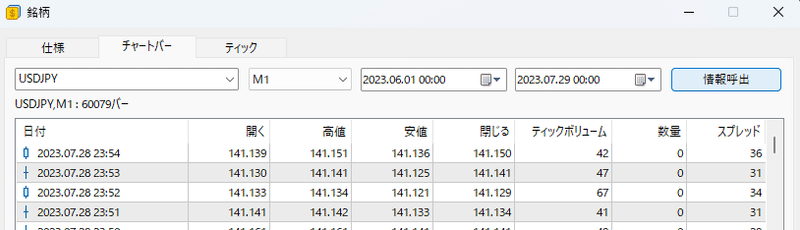
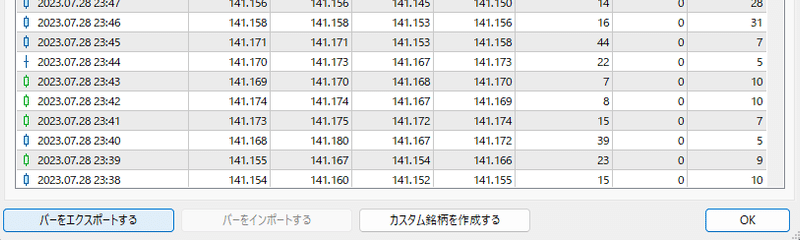
●MT5の1分足データ
1分足のデータをダウンロードして
保存時に、名前を「USDJPY_M1」にしてください。
※どこの業者のデータでもMT5であれば大丈夫なはず
※3ヶ月分くらいなら大丈夫だと思いますが、あまり長期間のデータにしてしまうとCSVに書ききれなかったりするので、使う期間だけにしましょう
準備
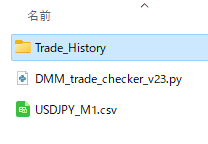
ダウンロードしたDMMFXの約定履歴を「Trade_History」というフォルダを作成して入れてください。
スクリプトと同じ場所に、1分足データを置いてください。
使い方
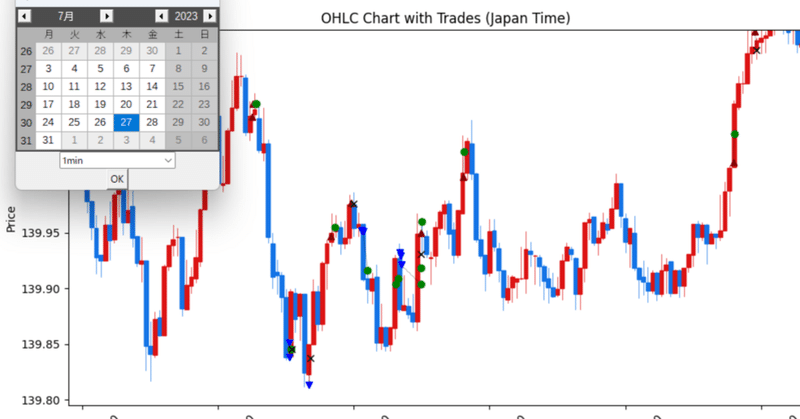
スクリプトを起動すると、カレンダーが出てきます。
描画したい日付を選択して、1分足、5分足、15分足から選択します。
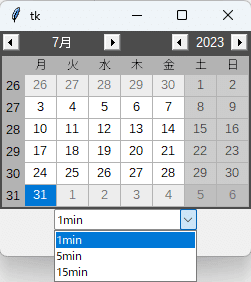
OKを押すと、チャートが描画されます。
丸1日分が描画されるのでぎっしりです。
新規買い:▲ 新規売り:▼ 利益決済:● 損失決済:✕
で表記されます。
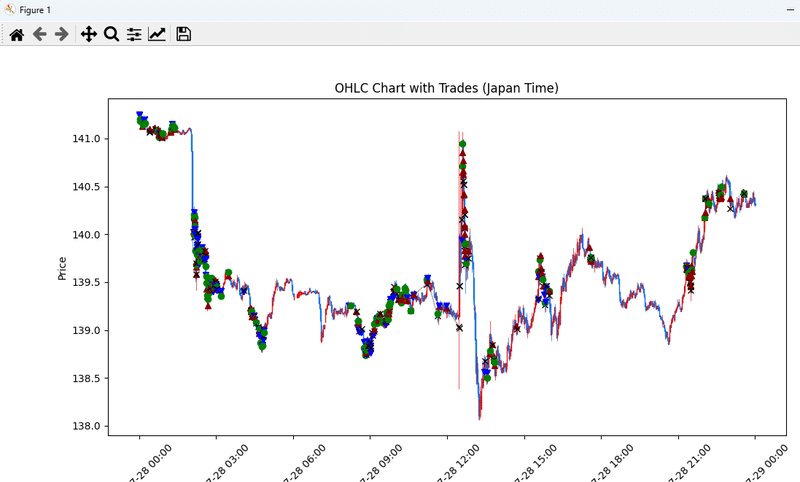
これは仕様なのでどうにもならないのですが、このチャートツールがめちゃ使いづらいです。見たいところを上のアイコンの虫眼鏡を選択して拡大。十字キーみたいなやつで移動します。Cキーで拡大から戻ります。
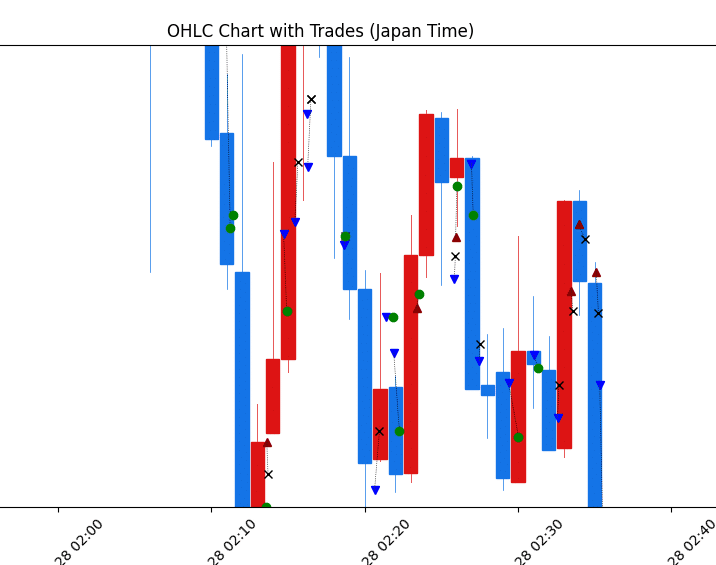
他の業者の約定履歴だと新規と決済に注文番号で紐づけがあるのですが、DMM FXの約定履歴には注文を紐付ける情報が無いので、擬似的に直近の新規と決済を線で結んでいます。分割決済していたりすると、上手く線が描画されません。目安程度に考えてください。
以下コード。
エディタにコピペして.pyで保存してください。
import pandas as pd
import os
import matplotlib.pyplot as plt
import matplotlib.dates as mdates
from mpl_finance import candlestick_ohlc
import tkinter as tk
from tkcalendar import Calendar
from datetime import datetime, timedelta
from tkinter import ttk
import sys


if getattr(sys, 'frozen', False):
    # EXEとして実行されている場合
    application_path = os.path.dirname(sys.executable)
else:
    # スクリプトとして実行されている場合
    application_path = os.path.dirname(os.path.abspath(__file__))

# データファイルとトレード履歴ディレクトリのパスを設定
data_path = os.path.join(application_path, 'USDJPY_M1.csv')
trade_history_dir_path = os.path.join(application_path, 'Trade_History')


def load_trade_data(directory):
    # List all csv files in the directory
    files = [f for f in os.listdir(directory) if f.endswith('.csv')]

    # Load each csv file and append to a list of dataframes
    dfs = [pd.read_csv(os.path.join(directory, f), encoding='shift-jis') for f in files]

    # Concatenate all dataframes into one
    trade_data = pd.concat(dfs)

    # Convert '約定日時' to datetime and set as index
    trade_data['約定日時'] = pd.to_datetime(trade_data['約定日時'])
    trade_data.set_index('約定日時', inplace=True)

    return trade_data

def plot_ohlc_with_trades(ohlc_data, trade_data, start, end, width):
    # Ensure the data is sorted by datetime
    ohlc_data = ohlc_data.sort_index()
    trade_data = trade_data.sort_index()

    # Extract data for the given date range
    data_range = ohlc_data.loc[start:end]
    trade_range = trade_data.loc[start:end].copy()  # Make a copy of the slice

    # Prepare data for OHLC plot
    ohlc = data_range[['<OPEN>', '<HIGH>', '<LOW>', '<CLOSE>']].copy()
    ohlc.reset_index(inplace=True)
    ohlc['Datetime'] = ohlc['Datetime'].map(mdates.date2num)

    # Create plot
    fig, ax = plt.subplots(figsize=(12,6))

    # Plot OHLC data
    candlestick_ohlc(ax, ohlc.values, width=width, colorup='#DC1414', colordown='#1474E6')  # Adjusted RGB values

    # Convert '決済損益(円)' to numeric
    trade_range['決済損益(円)'] = trade_range['決済損益(円)'].str.replace('\\', '').str.replace(',', '').astype(float)  # Remove backslash and comma, then convert to float

    # Plot trades
    last_buy = None
    last_sell = None
    for idx, row in trade_range.iterrows():
        color = 'black'
        marker = 'o'
        if '新規' in row['区分']:
            if '買' in row['売買']:
                color = '#8B0000'  # dark red
                marker = '^'
                last_buy = (idx, row['約定レート'])
            elif '売' in row['売買']:
                color = '#0000FF'  # blue
                marker = 'v'
                last_sell = (idx, row['約定レート'])
        elif '決済' in row['区分']:
            if row['決済損益(円)'] >= 0:
                color = 'green'
            else:
                color = 'black'
                marker = 'x'
            if last_buy is not None:
                ax.plot([last_buy[0], idx], [last_buy[1], row['約定レート']], color='black', linestyle='dotted', linewidth=0.5)  # Adjusted linewidth
                last_buy = None
            if last_sell is not None:
                ax.plot([last_sell[0], idx], [last_sell[1], row['約定レート']], color='black', linestyle='dotted', linewidth=0.5)  # Adjusted linewidth
                last_sell = None
        ax.plot_date(idx, row['約定レート'], fmt=' ', color=color, marker=marker)  # Remove marker from fmt

    # Format x-axis
    ax.xaxis_date()
    ax.xaxis.set_major_formatter(mdates.DateFormatter('%Y-%m-%d %H:%M'))

    # Set plot title and labels
    ax.set_title('OHLC Chart with Trades (Japan Time)')
    ax.set_xlabel('Time')
    ax.set_ylabel('Price')

    # Rotate x-axis labels
    plt.setp(ax.get_xticklabels(), rotation=45)

    # Show plot
    plt.show()

# Load MT5 OHLC data
data_path = os.path.join(application_path, 'USDJPY_M1.csv')
data = pd.read_csv(data_path, delimiter='\t')  # Modify this line
data['Datetime'] = pd.to_datetime(data['<DATE>'] + ' ' + data['<TIME>'])
data['Datetime'] = data['Datetime'] + pd.Timedelta(hours=6)
data.set_index('Datetime', inplace=True)

# Load trade record data from all csv files in the specified directory
trade_history_dir_path = os.path.join(application_path, 'Trade_History')
trade_data = load_trade_data(trade_history_dir_path)  # Modify this line

# Create a root window
root = tk.Tk()

# Create a calendar and a button
cal = Calendar(root)
button = tk.Button(root, text="OK", command=root.quit)

# Create a combo box for time frame selection
time_frame = ttk.Combobox(root, values=['1min', '5min', '15min'])
time_frame.current(0)  # Set default value

# Pack the calendar, the combo box, and the button into the window
cal.pack()
time_frame.pack()
button.pack()

# Run the main loop
root.mainloop()

# Get the selected date and time frame
selected_date = cal.selection_get()
selected_time_frame = time_frame.get()

# Resample the data according to the selected time frame
if selected_time_frame == '5min':
    data = data.resample('5T').agg({
        '<OPEN>': 'first',
        '<HIGH>': 'max',
        '<LOW>': 'min',
        '<CLOSE>': 'last'
    })
    width = 0.003
elif selected_time_frame == '15min':
    data = data.resample('15T').agg({
        '<OPEN>': 'first',
        '<HIGH>': 'max',
        '<LOW>': 'min',
        '<CLOSE>': 'last'
    })
    width = 0.009
else:
    width = 0.0006  # For 1min

# Calculate the start and end times
start = datetime.combine(selected_date, datetime.min.time())
end = start + timedelta(days=1)

# Plot the data
plot_ohlc_with_trades(data, trade_data, start, end, width)
よければ良いねとRTをお願いします…!
ここから先は
¥ 300
この記事が気に入ったらサポートをしてみませんか?