フットボール統計学 k平均法によるパス分析でプレースタイルを探る

USING K-MEANS TO LEARN WHAT SOCCER PASSING TELLS US ABOUT PLAYING STYLES
MARCH 11, 2019 By Cheuk Hei Ho (@tacticsplatform) and Eliot McKinley (@etmckinley), colloquially known as CheuKinley
It's interesting that some of the Crew's most under-represented pass types in 2013, Warzycha's final year, became some of their most over-represented pass types in 2018, Berhalter's final year. Also, 2015 was such an outlier for Berhalter's tenure. pic.twitter.com/8HuPXqJv2d
— Eliot McKinley (@etmckinley) March 11, 2019
https://t.co/zQuBdhLgSS
— Cheuk Hei Ho (@Tacticsplatform) March 11, 2019
"Pep Guardiola’s Manchester City are an obvious example, but there are others such as Atletico Madrid under Diego Simeone, ....... Can anyone identify what the Juventus way of playing actually is?"
it's called switching pic.twitter.com/cK6wSB77wW
When you talk about a soccer team, you almost always talk about its style: high-pressing, possession-heavy, parking-the-bus, etc. A team’s style not only signifies how they play on the field but also reflects its coaching. Since there aren't guidelines on how the style of the team should be defined, everyone uses their own rules and we can't directly compare each other's descriptions.
サッカーチームについて話すとき、ハイプレッシングやポゼッション重視、バスを停めるなど、ほぼいつもそのスタイルについて話す。チームのスタイルは、フィールドでのプレー方法を表すだけでなく、そのコーチングも反映する。チームのスタイルの定義方法に関するガイドラインがないため、全員が独自のルールを使用し、お互いの説明を直接比較できない。
An accurate quantitative description of the style is needed. It can help one to properly analyze not only the opponent's team but also his/her own team. With an accurate method to describe the style, one can scientifically evaluate if a training exercise is efficient at serving its purpose. We previously have used dimension reduction technique, t-SNE, to find MLS teams with similar styles based on the spatial distribution of activities and pass networks. This time we use a different method, k-means clustering of pass types, to quantitatively measure style, tactical specialization, and the influence of coaching on a team’s system.
スタイルの正確な定量的説明が必要である。相手チームだけでなく、自分のチームも適切に分析するのに役立つ。スタイルを記述するための正確な方法を使えば、トレーニングがその目的を果たす上で効率的かどうかを科学的に評価することができる。アクションの空間分布とパスネットワークに基づいて、類似のスタイルを持つMLSチームを見つけるために、以前次元圧縮手法であるt-SNEを使用した。今回はスタイルや戦術的特化、チームのシステムに対するコーチングの影響を定量的に測定するために、パスの種類のk平均法という別の方法を使用する。
European teams' style by possession characteristics using t-SNE, a machine learning method
— Cheuk Hei Ho (@Tacticsplatform) November 28, 2018
Two main clusters: contenders and bystanders
Contenders separate into 2 groups: Man City/Juve vs. Barca/Real Madrid/Chelsea
Man Utd is very much in the bystanders' group@etmckinley pic.twitter.com/Efoa1h5ofS
※t-SNE(t-distributed Stochastic Neighbor Embedding)は、Laurens van der Maaten氏とジェフリー・ヒントン氏によって開発された視覚化のための機械学習アルゴリズムである。これは、2次元または3次元の低次元空間に視覚化のため高次元データを埋め込むのに最適な非線形次元圧縮手法である。具体的には高い確率で、類似のオブジェクトが近くの点に、相違のオブジェクトが離れた点にモデル化されるように、各高次元オブジェクトを2次元または3次元の点でモデル化する。
t-SNEアルゴリズムは2つの主な段階を含む。まずt-SNEは、類似のオブジェクトが拾われる可能性が高い一方で、相違の点が拾われる可能性が極めて小さいように、高次元のオブジェクトのペアにわたる確率分布を構築する。第二に、t-SNEは低次元マップ内の点にわたって同様の確率分布を定義し、それはマップ内の点の位置に関して2つの分布間のカルバック・ライブラー情報量を最小化する。元のアルゴリズムではオブジェクト間のユークリッド距離をその類似性指標のベースとして使用しているが、これは必要に応じて変更する必要がある。
t-SNEはコンピュータセキュリティ研究、音楽分析、癌研究、生命情報科学、生物医学的信号処理など幅広い応用での視覚化に使用されてきた。人工ニューラルネットワークによって学習された高レベルの表現を視覚化するためによく使用される。
t-SNEプロットは多くの場合クラスタを表示するように見えるが、視覚的クラスタは選択されたパラメータ化によって強く影響される可能性があるため、t-SNEのパラメータをよく理解することが必要である。このような「クラスタ」は、非クラスタ化データにも現れることがあるため、誤った結果になる可能性がある。そのため、パラメータを選択して結果を検証するためには、対話型の探索が必要になる場合がある。t-SNEはよく分離されたクラスタを回復できることが多く、特別なパラメータを選択することで、単純な形のスペクトルクラスタリングに近いことが実証されている。
@etmckinley and I use t-SNE (t-distributed stochastic neighbor embedding), a machine learning algorithm using nonlinear dimensionality reduction technique to classify MLS teams from 2016-2018 based on possession characteristics and pass networks. https://t.co/TZa5wxfBqR pic.twitter.com/zIbImdER5N
— Cheuk Hei Ho (@Tacticsplatform) November 27, 2018
K-means clustering of passes
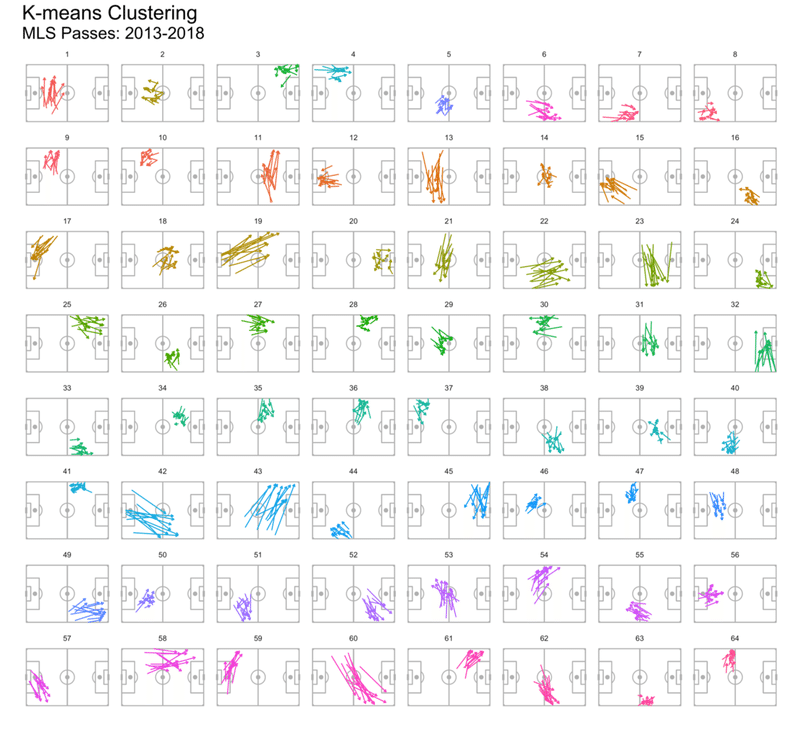
We used k-means clustering of pass types to quantify the styles of the teams in MLS. K-means clustering is a machine learning algorithm that separates data points into a user selected (k) number of clusters based upon their similarities. If you think that two clusters define the groups you want, you will choose k=2. If you think it is 10, choose 10. In our case, after using the elbow method and visual inspection, we chose to classify passes into 64 different groups based upon how and where passes were made. We want to note that using k-means clustering has been used many other times to describe passing behavior in soccer (and we used it, in part, to classify player positions). We extended previous work by using z-scores to standardize the quantification of each pass group. Then by filtering pass clusters based on z-scores we can find characteristic pass patterns for every team.
MLSでチームのスタイルを定量化するために、パスの種類のk平均法を使用した。k平均法は、データポイントを類似性に基づいてユーザーが選択した(k)個のクラスタに分離する機械学習アルゴリズムである。クラスタ数2個が必要なグループを定義していると思われる場合は、k=2を選択する。10であると思うならば、10を選ぶ。今回の場合は、エルボー法と視覚化検証を使用した後、パスの種類と場所に基づいて、パスを64の異なるグループに分類することを選択した。k平均法を使用することは、サッカーでのパスの挙動を記述するために他にも多く使用されてきた(そして部分的に、選手の位置を分類するために使用した)。各パスグループの定量化を標準化するために標準得点を使用して以前の作業を拡張した。次に、標準得点に基づいてパスクラスタをフィルタリングすることで、すべてのチームの特徴的なパスパターンを見つけられる。
※エルボー法は、データセット内の適切なクラスタ数を見つけるのに役立つように設計されたクラスタ分析内での一貫性の解釈や検証の方法である。この方法では、クラスタ数の関数として説明された分散の割合を調べる。別のクラスタを追加してもデータのモデリングがそれほど良くならないように、いくつかのクラスタを選択する必要がある。
より正確には、クラスタ数に対してクラスタによって説明される分散の割合をプロットすると、最初のクラスタは多くの情報を追加するが(多くの分散を説明する)、ある時点で差得が低下し、グラフの角度が変わる。この時点でクラスタ数が選択され、よって「エルボー基準」となる。この「エルボー」は常に明確に識別できるわけではない。説明された分散の割合は、全分散に対する集団間の分散の比率で、F検定とも呼ばれる。この方法を少し変更すると、集団内分散の曲率がプロットされる。
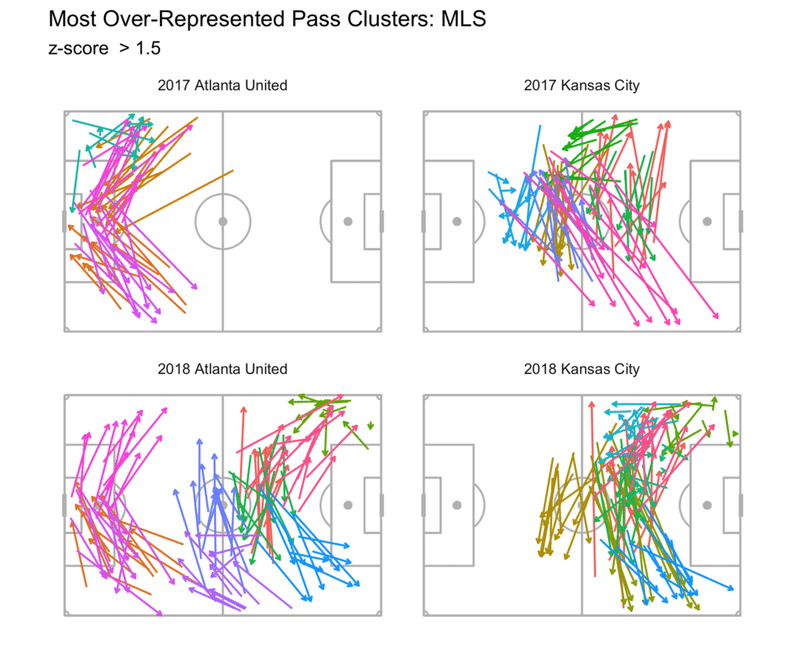
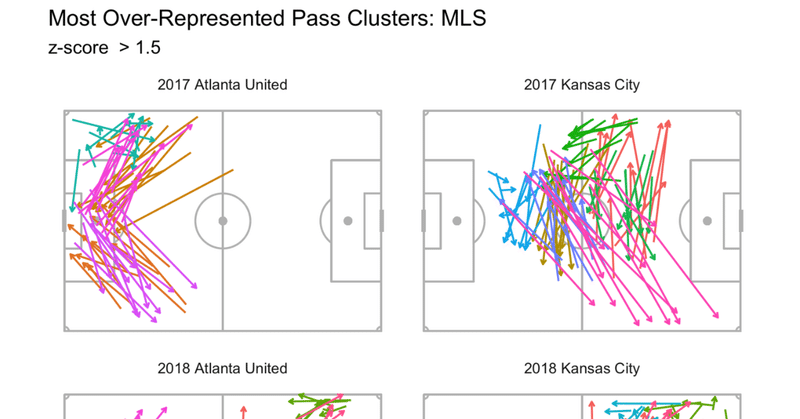
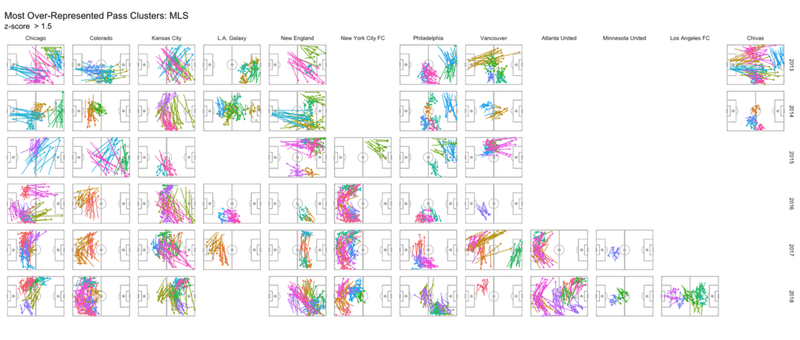
This visualization combines the features of both pass network and touch heatmap. It shows what areas a team utilizes the most and how (what type of passes) it uses to access this zone. For example, last season, Atlanta used long horizontal passes to stretch the opponent while Kansas City camped outside the opponent’s box with its possession dominance. By plotting distinctive pass types this way, we can also see how a team evolves under a coach. For instance, Tata Martino had clearly instructed how Atlanta played out from the back, however, it was a work-in-progress in the first year. They got the build-up part right but had trouble transitioning into the attack. With another full season to practice, they exploded into one of the best offensive teams in MLS history in their second season.
この視覚化は、パスネットワークとタッチヒートマップの両方の機能を組み合わせたものである。これは、チームがどの領域を最も利用しているか、およびこのゾーンへのアクセスにどのように使用しているか(どのような種類のパスか)を示している。例えば昨シーズン、アトランタは相手を引き伸ばすために縦へロングパスを使用したが、カンザスシティはポゼッションで相手のボックスの外側を支配した。このように特徴的なパスの種類をプロットすることで、チームがコーチのもとでどのように進化していくかを見ることもできる。例えば、ヘラルド・マルティーノはアトランタがどのように後ろからプレーするかを明確に指揮したが、しかし最初の年は仕掛かりだった。彼らはビルドアップの部分をすぐに手に入れたが、攻撃に移行するのに苦労した。別のフルシーズンの練習で、彼らは2シーズン目でMLS史上最高の攻撃チームの1つに爆発した。

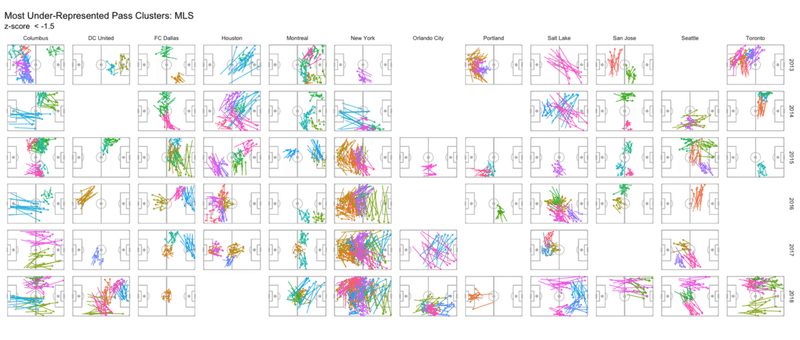
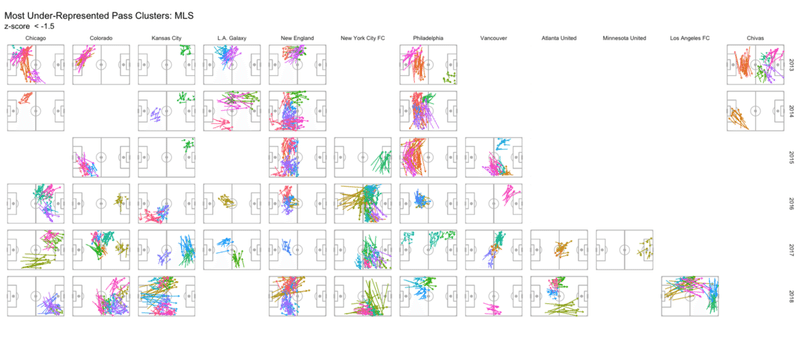
By varying the z-score to filter the data, you can look at the under-presented pass types and choose the degree of representation. In 2018, Columbus did not utilize long passes out of the back often, LAFC was less likely to cross from the flanks, and Portland didn’t pass from central locations back towards their own goal.
データをフィルタリングするために標準得点を変更することで、低く提示されているパスの種類を調べて表現の程度を選択できる。2018年、コロンブスは後ろからのロングパスを頻繁に利用せず、LAFCはサイドからあまりクロスを上げず、ポートランドは中央の位置から自分のゴールに向かってバックパスをしなかった。
Tactical specialization
Using z-scores not only gives us a standardized score to evaluate the degree of representation of each pass cluster but also a quantitative measure of a team’s tactical specialization. Each z-score measures how much different a team is in using one type of passes compared to everyone else. If we take the median of the absolute value of the z-scores (since because both over- and under-representation equate to specialization, thanks for the idea, Dummy Run) per team, we approximate how much different a team is to everyone else.
標準得点を使用すると、各パスクラスタの表現の程度を評価するための標準化されたスコアだけでなく、チームの戦術的特化の定量的な尺度も得られる。各標準得点は他と比べて、チームが1種類のパスを使用することにどの程度の違いがあるかを測定する。チームごとに標準得点の絶対値の中央値をとると(過大表現と過小表現の両方が特化に等しい、Dummy Run氏のアイデア)、チームが他とどれほど異なるかを概算する。
Specialization does not necessarily mean a team is good or bad. There is only a weak, but significant, correlation between specialization and expected goal difference (R = 0.24, p = 0.007). In fact, two of the most specialized teams (>99th percentile) in the last seven years are New York City FC in 2016 and Colorado in 2018. Their most over-represented pass types are those that couldn’t get across the half-line. They are basically specialized in not passing forward. A non-ideal method of winning games, to say the least. The full table of specialization scores is at the bottom of this post.
特化は、チームが必ずしも良いか悪いかを意味するわけではない。特化とxG差との間には、弱いが重要な相関がある(R = 0.24、p = 0.007)。実際、過去7年間で最も特化された2つのチーム(99パーセンタイル以上)は、2016年のニューヨークシティFCと2018年のコロラドである。彼らの最も過剰に表現されているパスの種類は、ハーフウェイラインを越えることができなかったものである。彼らは基本的に前へパスしないことに特化している。控えめに言っても、ゲームに勝つための非理想的な方法である。特化スコアの完全な表は、この記事の最後にある。
The specialization scoring confirms some eye tests while refutes the others. For example, New York Red Bulls are believed to be the most distinctive franchise in MLS. The top five most distinctive teams from the last seven years include three Red Bulls, all under the supervision of Jesse Marsch (and Chris Armas last year). In contrast, many pundits believe that Columbus Crew under Gregg Berhalter played with a very unique style. However, their specialization scores suggest that they have been less specialized than most teams in the last four seasons. These are good examples of how an objective measure of style can help judge whether our subjective opinion stands.
特化スコアはいくつかの目視を確認する一方、他に反論する。例えば、ニューヨーク・レッドブルズはMLSで最も特徴的なフランチャイズと考えられている。過去7年間で最も特徴的な上位5チームには、3シーズン分のレッドブルが含まれており、これらはすべてジェシー・マーズチ(および昨年のクリス・アルマス)の監督下にある。これとは対照的に、多くの専門家はグレッグ・バーホルターの下のコロンバス・クルーが非常にユニークなスタイルでプレーしたと考えている。しかし彼らの特化スコアは、過去4シーズンでほとんどのチームよりも特化が劣っていることを示唆する。これらは、客観的なスタイルの尺度が、主観的な意見が正しいかどうかを判断するのに役立つ方法の良い例である。
Coaching influences tactical systems
The specialization score only tells us whether a team is different from everyone else, but it doesn’t tell us whether two teams are similar or not. Two teams can have very similar specialization scores but they can be specialized in different ways. Quantifying the way two teams play can tell us how coaching change or player turnover can impact the play style of the team.
特化スコアは、チームが他と異なるかを示すだけだが、2チームが似ているかはわからない。2チームは非常に似た特化スコアを持つが、異なる方法で特化することができる。2チームのプレー方法を定量化すると、コーチングの変更や選手の移籍がチームのプレースタイルにどのように影響するかがわかる。
To quantify the similarity of the play styles of the same team in two consecutive seasons, we calculate the Euclidean distance of the z-score for each cluster between seasons. We then do another z-score to standardize the resultant score and calculate a percentile to determine how the change between two years are compared to every other transition in the last seven seasons (note: above 50 is greater than average difference, below 50 less than average difference):
連続した2シーズンにおける同じチームのプレースタイルの類似性を定量化するため、シーズン間の各クラスタの標準得点のユークリッド距離を計算する。次に、得られたスコアを標準化するために別の標準得点を作成し、過去7シーズンの他の全推移と比較しての変化を決定するためのパーセンタイルを計算する(注:50以上は平均差より大きく、50以下は平均差より小さい)。
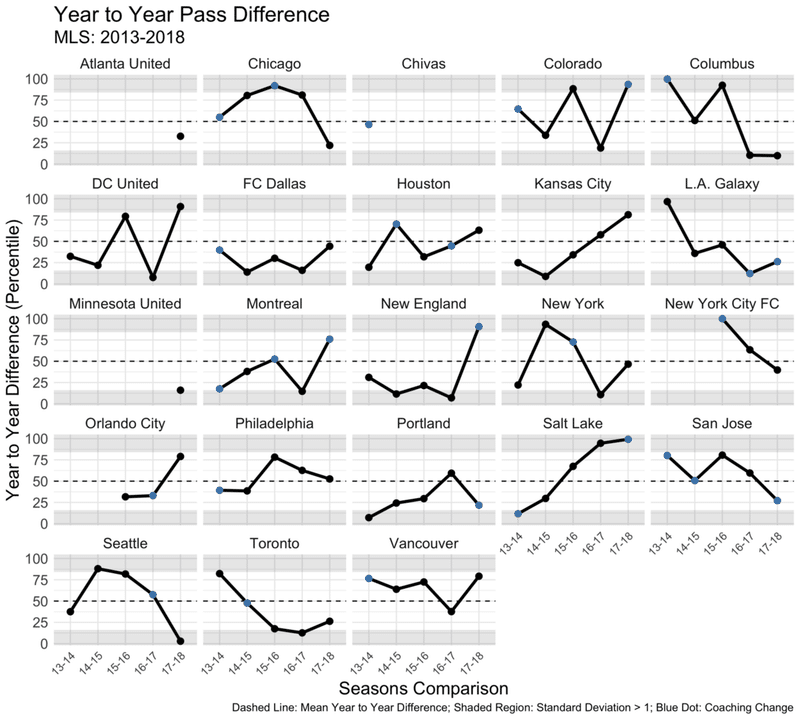
A coaching change seems to be the strongest driver in the evolution of the play style; even though the New York Red Bulls are the most distinctive franchise in the MLS, their style has been consistent under Marsch since 2016. Large differences in similarities were seen in Columbus when Gregg Berhalter took over for Robert Warzycha (2013-2014), NYCFC transitioning from Jason Kreis to Patrick Vieira (2015-2016), and New England in Brad Friedel's first season (2017-2018) after years of below average change under Jay Heaps. However coaching changes don’t always bring change, Portland, San Jose, and LA Galaxy showed less than average change when moving to new coaches. Interestingly, since 2015, SKC has shown increased year-over-year differences under Peter Vermes. While Ben Olsen and Pablo Mastroeni showed wild swings year-to-year during their respective tenures at DC United and Colorado.
指揮官の変更は、プレースタイルの進化における最強の推進力と思われる。ニューヨーク・レッドブルズはMLSの中で最も独特のフランチャイズだが、そのスタイルは2016年以来ジェシー・マーズチの下で一貫している。グレッグ・バーホルターがロベルト・ヴァジハ(2013-2014)から引き継いだ時のコロンブス、ジェイソン・クライスからパトリック・ヴィエラ(2015-2016)に移行したニューヨーク・シティFC、およびジェイ・ヒープスの下で平均以下の変化後のブラッド・フリーデルの最初のシーズン(2017-2018)のニューイングランドに、類似性に大きな違いが見られた。しかし、指揮官の変更が必ずしも変化をもたらすわけではなく、ポートランド、サンノゼ、およびLAギャラクシーは、新指揮官に移行したときに平均的な変化よりも少なかった。興味深いことに2015年以来、SKCはピーター・バーミーズの下で年々の違いを示している。一方、ベン・オルセンとパブロ・マストローニは、DCユナイテッドとコロラドでそれぞれの任期中に年々野生のスイングを見せた。
Conclusion
Our next steps will be to link our quantitative measurement of the style to some forms of performance index. For example, some teams may predominantly use a pass type, but at a low success rate. In that case, a coach may want to decide how important that cluster is for the team’s function. He or she may want to introduce a new training regimen to improve the performance of that pass type, use different players in those positions, or even alter the pass routes to bypass it. We can look at the outcome of the style by linking pass clustering with the pass chain concept and rate them with Expected Goal Chain. This way, we can find all groups of classes that produce the most damage for any team. Imagine three linked forward pass clusters in which the middle cluster is under-represented and sandwiched by two over-represented ones. Immediately you will know that the under-represented cluster is the weakest link; your team may use other actions such as dribbles or carries to move the ball through that area. The coach may want to instruct his/her players to pass more than they are doing. The opponent’s coach may want to hit that area or player.
次のステップは、スタイルの定量的測定を何らかの形のパフォーマンス指標に結び付けることである。たとえば、一部のチームは主にあるパスの種類を使用するが、成功率は低くなる。その場合、コーチはそのクラスタがチームの機能にとってどれほど重要かを決定したいと思うかもしれない。そのパスの種類のパフォーマンスを向上させるために新しいトレーニングを導入したり、それらの位置で異なる選手を使ったり、あるいはそれを回避するためにパスルートを変更したりしたいと思うかもしれない。パスクラスタとポゼッション連鎖の概念を結び付けてスタイルの結果を調べ、xGChainでそれらを評価できる。このようにして、どのチームにも最も大きな打撃を与えるクラスの全グループを見つけられる。3つの結び付いた縦パスクラスタ、その中で中央のクラスタが過少表示され、2つの過大表示されたものに挟まれているのを想像する。すぐに、過小評価されたクラスタが最も弱いリンクと知るだろう。チームはドリブルや前進のような他のアクションを使ってボールをその領域に移動させられる。コーチは、選手がしている以上にパスするようにに指示したいかもしれない。相手コーチは、そのエリアまたは選手を打撃したいと思うかもしれない。
Applications like these are the tip of the iceberg in how this type of analysis can help coaching. Things like this can provide “actionable insights”, the holy grail of the soccer analytics.
この種の分析がコーチングにどのように役立つかについては、このような応用が氷山の一角である。このようなものは、「実用的な洞察」、サッカー分析の聖杯を提供することができる。
Below: Over- and under-represented pass clusters for every team in each MLS season since 2013.
以下:2013年以降の各MLSシーズンの各チームの過大、過小表示されたパスクラスタ。

What the "k" do you means? @etmckinley & @tacticsplatform take a look at how to use data to define playing styles. https://t.co/aeeRYFYr4V
— American Soccer Analysis (@AnalysisEvolved) March 11, 2019
I worked with @etmckinley to define MLS teams' styles, unique tactics, and year-to-year tactical change by k-means clustering of passes.https://t.co/EbW1Wn2CP5
— Cheuk Hei Ho (@Tacticsplatform) March 11, 2019
More info about what how this all works is here: https://t.co/2C8yCiwNap
— Eliot McKinley (@etmckinley) March 11, 2019
ここから先は
¥ 100
#フットボール統計学