フットボール統計学 パスの価値と指標化 線形重回帰分析

Valuing Passes and Thoughts on Metrification
manVmetrics – GARRY GELADE
January 1st, 2019
In my last post, I looked at passing performance and identified players with pass completion rates higher than expected, given the difficulty of the passes they attempted. This seemed to pass the eyeball test, throwing up players like Kroos, Ozil, Arjen Robben and Messi as top performers on this metric.
前回の投稿で、パスのパフォーマンスを見て、試みたパスの難しさを考えると、期待値より高いパス成功率を持つ選手を識別した。これは眼球テストに合格したようで、クロースやエジル、アリエン・ロッベン、メッシのような選手をこの測定基準のトップパフォーマーとして投入した。
But closer inspection reveals a bit of a problem. Kroos for example, who turns out to be the top-rated midfield passer, has a pass completion rate 3.9% higher than average. This equates to only 3 more completed passes per match. The numbers for the other top players are similar; it seems difficult to believe that a tiny handful of extra passes could have any noticeable affect the outcome of a match.
しかし、よく調べてみると、少し問題がある。たとえばクロースは、最高の評価を得ている中盤のパサーであることがわかっており、パス成功率は平均より3.9%高い。これは、1試合につき3回以上のパス成功を意味する。他のトップ選手の数字は似ている。ごくわずかな余分なパスが、試合の結果に顕著な影響を与える可能性があると信じるのは難しい。
So maybe, the answer lies in the 80-90 percent or so of passes that all players complete anyway. Perhaps top players somehow make better passes. This brings up the question of how to value a pass, which is the initial topic of this post. Though, fair warning, I do meander and drift somewhat into more open waters.
恐らく、答えはとにかくすべての選手が80-90%かそこらのパス成功率にある。おそらくトップ選手はとにかくより良いパスを作る。これは、この記事の最初のトピックである、パスをどのように評価するかという問題を提起する。しかし、公正な警告だが、蛇行し、より開放的な水域にいくらか漂流する。
The scheme I will use depends on the idea of a ‘value surface’; this associates each location on the pitch with some value for being in possession at that location. The reward of a pass is then the difference in values between the start and end of the pass. So how do we assign the values? For present purposes, I’m going to define the value at any location p as the probability that possession at p leads to a shot. (I could have used xG instead of shots, but let’s keep it simple.) We can now define the Pass Reward as the increase in probability of a shot before and after the pass.
使用する図式は「価値面」の考えに依存する。これにより、ピッチ上の各場所がその場所でのポゼッションに対する何らかの値と関連付けられる。パスの報酬は、パスの開始地点と終了地点の値の差である。それでは、どのように値を割り当てるか。現在の目的のために、任意の場所の値pをpのポゼッションがシュートをもたらす確率として定義する(シュートの代わりにxGを使用できたが、単純にしておく)。パス報酬を、パスの前後のシュートの確率の増加として定義することができる。
At this point it is probably worth mentioning some other models that have been developed to value passes, or the passing contributions of individual players. They all look somewhat alike on casual inspection, but there are some key differences to note. (In the next paragraph I oversimplify, but mainly to highlight the real differences in approach.)
現時点では、パス、もしくは個々の選手のパス貢献を評価するために開発された他のモデルについて言及する価値があるだろう。それらはすべてカジュアルな検証でやや似ているが、注意すべきいくつかの重要な違いがある(次の段落で単純化しすぎているが、主にアプローチの実際の違いを強調する)。
1. Progressive Passing Value Added (Opta). This model uses a value surface, defined by distance from goal. The reward of a pass is the difference between the values of the start and end locations. Unsuccessful passes count against.
2. xG_added (Nils Mackay). This model also uses a value surface, with values determined by a transform of location. Specifically, the distance to goal and the angle subtended by the ball and the goal posts are transformed to an xG value by an xG model, and the values of locations are xGs. Advanced versions of the model include additional pass attributes, but it remains at heart a weighted location model.
3. The xGChain (StatsBomb). This scheme is used to assess players rather than passes. In this model, the value of a pass depends on the outcome of the passing sequence it belongs to. If the sequence ends in a shot, each player who participated in the sequence is credited with the xG value of the shot.
4. Goal Probability Added (Sarah Rudd). In this model, the reward of a pass is the change in probability of scoring a goal before and after the pass. Despite using a different value metric (goals as opposed to shots), the underlying philosophy of this model is the same as mine, in that both determine the values of actions in terms of probabilities. The main difference is that SR’s model (to use Markov decision process language) uses discounted rewards (i.e. including the anticipated future rewards of an action), while my model uses only the immediate rewards.
1. 前進パス価値追加(Opta社)。このモデルは、ゴールからの距離で定義される価値面を使用する。 パス報酬は、開始位置と終了位置の値の差である。失敗したパスは(相手にもしくはマイナスに?)カウントされる。
2. xGadded(Nils Mackay氏)。このモデルはまた、価値面を使用し、値は位置の変換によって決定される。具体的には、ゴールまでの距離と角度は、xGモデルによってxG値に変換され、位置の値はxGである。このモデルの最新バージョンにはパスの種類が含まれるが、それは重要な部分として位置重み付きモデルのままである。
3. xGChain(StatsBomb社)。この図式は、パスではなく選手の評価に使用される。このモデルではパスの値は、それが属するポゼッション連鎖の結果によって異なる。ポゼッション連鎖がシュートで終了した場合、ポゼッション連鎖に参加した各選手はシュートのxG値を受け取る。
4. 得点確率追加(Sarah Rudd氏)。このモデルでは、パス報酬はパスの前後での得点確率の変化である。異なる値の指標(シュートとは対照的な得点)を使用しているにもかかわらず、このモデルの基本的な考え方は、確率の観点からアクションの値を決定するという点で、私と同じである。主な違いは、(マルコフ決定プロセス言語を使用する)SR氏のモデルは割引報酬(すなわち、予想される将来のアクションの報酬を含む)を使用するのに対し、私のモデルは即時報酬のみを使用することである。
This by no means exhausts the number of pass evaluation schemes I have seen. For example, in the IMPECT model, the value of a passes depends on the number of critical defenders it cuts out. The point I want to stress is we have quite a number of schemes (and although they might have their individual pros and cons, we have relatively little evidence of their respective merits.)
これは、これまでに見たパス評価図式の数を決して使い果たすことはない。たとえば、IMPECTモデルでは、パスの値はそれが切り取った重要な守備人数によって異なる。強調したいのは、かなりの数のスキームを持っているということである(そしてそれぞれ長所と短所があるかもしれないが、それぞれの長所についての証拠は比較的少ない)。
With that out of the way, let’s look at the value surface for shots. The data for the surface pictured below comes from the three seasons 2015-2017 in the top five European leagues.
邪魔にならないように、ショットの価値面を見てみよう。下図のデータはトップ5のヨーロッパのリーグの3シーズン2015-2017から来る。
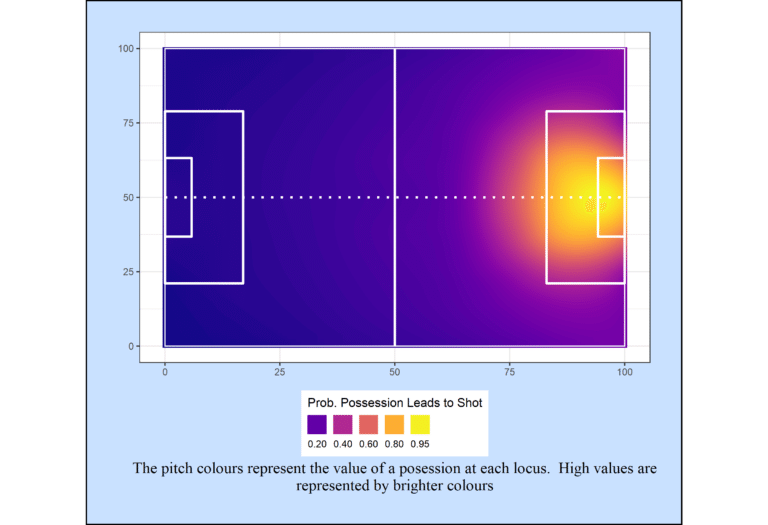
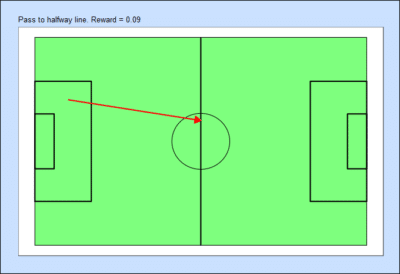
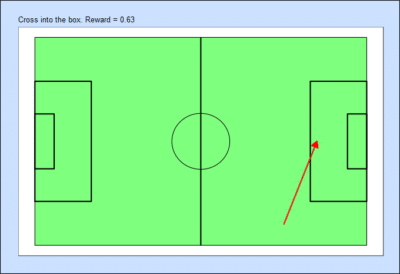
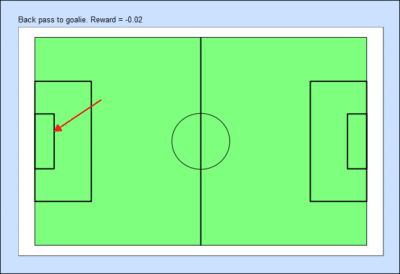
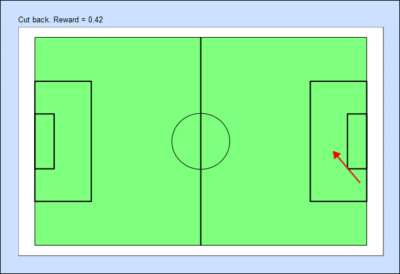
As might be expected, the value of possession increases as we get closer to the opposition goal. To get a feel for the sizes of pass rewards, the figures below show the rewards for four common types of pass.
予想通り、敵ゴールに近づくにつれてポゼッションの価値は高まる。 パス報酬のサイズを把握するために、以下の図は4種類の一般的なパス報酬を示す。
The Madness of Metrification
Now let’s look at some of the attributes of pass rewards. The mean is 0.046, and the sd is 0.14. The correlation between pass reward and pass completion is -0.58. This makes sense: high reward passes are more difficult to complete. It seems we have a plausible measure of the importance of a pass.
それでは、パス報酬のいくつかの種類を見てみよう。 平均は0.046、標準偏差は0.14です。 パス報酬と合格成功率の間の相関は-0.58である。 これは理にかなっている。高い報酬のパスは完了するのがより難しい。 パスの重要性についてもっともらしい尺度があるようである。
At this stage of the proceedings, few analysts and bloggers seem able to resist the temptation to metrify – if that’s even a word – the measure they have just constructed, and use it as a yardstick to evaluate players. It goes something like this.
この段階では、アナリストやブロガーの中には、たとえ一言でも、構築した指標を計量化し、選手を評価するための基準として使用したいという誘惑に抵抗できる人はほとんどいない。それはこのようになる。
Step 1. For each player, compute a per-90 score for the measure. In the present case, we would tot up the pass rewards for each player, divide by his minutes played and multiply by 90.
Step 2. Construct a list of the 20 or so players who score highest on the per-90 measure.
Step 3. Scour the list for the presence of Messi. If found, declare the birth of a new metric.
ステップ1. 各選手について、指標として90分あたりのスコアを計算する。 今回の場合、各選手のパス報酬を合計し、プレーした分で割って90を掛ける。
ステップ2. 90分あたりの指標で最高得点の20人ほどの選手のリストを作成する。
ステップ3. メッシの存在のためのリストを精練。 見つかった場合は、新しい指標の誕生を宣言する。
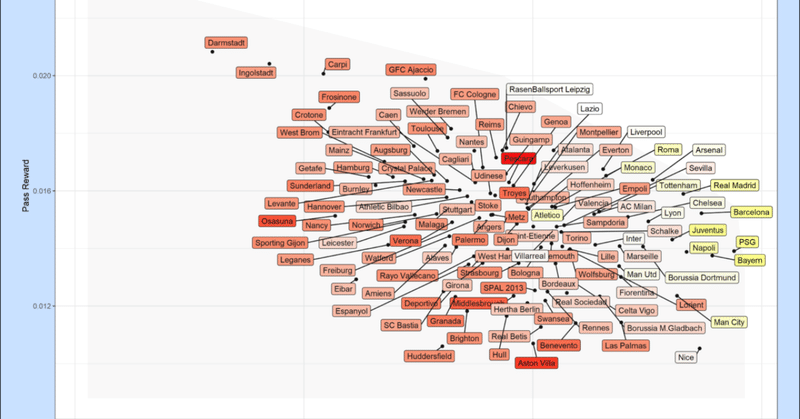
Needless to say, this ignores a few problems, not the least of which is that Messi has appeared on every top 20 list constructed by anybody anywhere, but let’s put that aside for now, and boldly metrify pass reward. The table below shows the results.
言うまでもなく、これはいくつかの問題を無視するが、そのうちメッシが誰かによって作成されたすべてのトップ20のリストに登場しているということだけではない。しかし、今はとりあえず、パス報酬を大胆に評価しよう。 以下の表に結果を示す。
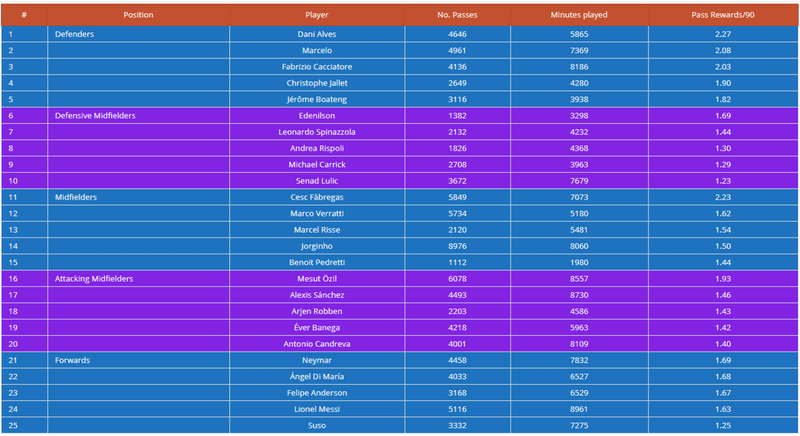
Well it doesn’t look to bad. It’s got Messi and Neymar on it, and a general selection of players who grace some of the best teams in Europe. But there are at least two other things we should do before announcing yet another football metric.
悪くなさそうである。 メッシとネイマール、そしてヨーロッパでも有数の優秀なチームに所属する選手たちが集まっている。 しかし、フットボール指標を発表する前に、やるべきことが少なくとも2つある。
First, we should be clear to what extent we have constructed a state measure, i.e. something that is expected to fluctuate across time or context, or a trait measure, i.e. something with a measure of stability. Of course the distinction is not always clear-cut, but it is important know where our proposed new metric sits. In the present case, we have 704 players who have played at least 540 minutes in each of two teams. The correlation between Rewards/90 in the two teams is 0.74, which suggests the metric is quantifying a real player characteristic, and can be considered a trait measure.
第一に、どの程度まで状態尺度(すなわち、時間や文脈にわたって変動することが予想されるもの)、または特性尺度(すなわち、安定性の尺度を有するもの)を講じてきたのかを明確にすべきである。もちろん区別は必ずしも明確ではないが、提案された新しい指標がどこにあるのかを知っておくことは重要である。今回のケースでは、2チームのそれぞれで少なくとも540分プレーした704人の選手がいる。2チームの90分あたりのパス報酬の相関は0.74で、この指標が実際の選手の特性を定量化していることを示しており、特性尺度と見なすことができる。
Even more important, before burdening the world with yet another metric to confuse scouts/upset Craig Burley/make money, we should provide at least some shred of evidence that what we have to offer is useful. Useful can mean for instance, illuminating a new aspect of the game, or predicting outcomes on the field better than existing metrics of the same type. How does Pass Reward (i.e. the average reward of a pass) compare in this respect? Actually not too well. It’s obviously not measuring anything that has not been measured before. And it doesn’t seem to be that brilliant at predicting outcomes on the field, at either the match level or the team*season level.
さらに重要なことは、スカウトを混乱させたり、Craig Burley氏を混乱させたり(※以前コメンテーターの彼がxGについて理解できず無駄と言い捨てた)、お金を稼ぐためのさらに別の指標で世界に負担をかける前に、進めるものが役立つという証拠の断片を少なくとも提供すべきである。たとえば、ゲームの新しい側面を明らかにしたり、同じ種類の既存の指標よりもフィールドでの成果を予測できれば役立つ。この点で、パス報酬はどのように比較されるか。実はあまりよくない。これまで測定されたことのないものは測定していない。そして、試合レベルでもチームシーズンレベルでも、現場での結果を予測することはそれほど素晴らしいとは思えない。
Take match level first. Pass Reward does add something, but its at the margins. Consider the regression
Goal_Diff(i,j)=B(0)+B(1)Pass_Completed(i,j)+B(2)Avg_Reward(i,j)
where i and j are the home and away teams, Goal_Diff is home team goals minus away team goals, Passes_Completed is the number of home team successful passses minus the number of away team successful passes and Avg_Reward is the average reward per pass for the home team minus the average reward per pass for the away team. The difference in average Pass Rewards is about 10% as important as the difference in the number of passes.
まず試合レベルを取る。パス報酬は何かを追加するが、それは余白である。 以下の回帰を考える
Goal_Diff(i,j)=B(0)+B(1)Pass_Completed(i,j)+B(2)Avg_Reward(i,j)
ここで、iとjはホームチームとアウェイチームで、Goal_Diffはホームチームの得点からアウェイチームの得点を引いたもの、Passes_Completedはホームチームのパス成功数からアウェイチームのパス成功数を引いたもの、そしてAvg_Rewardはホームチームの平均パス報酬からアウェイチームの平均パス報酬を引いたものである。 平均パス報酬の差は、パス数の差の10%くらい重要である。
(※Goal_Diffが線形重回帰分析の従属変数(目的変数)、Pass_CompletedとAvg_Rewardが独立変数(説明変数)、B(0)、B(1)、B(2)が係数(パラメータ))
If our outcome is a team’s average points per match over a season, and we estimate the linear regression equation below:
Avg_Points(i)=B(0)+B(1)Pass_Completed(i)+B(2)Avg_Reward(i)
it turns out that Passes Completed explains about 53% of the variance, and Pass Reward a further 4%.
結果がチームのシーズンの試合あたりの平均勝ち点である場合、以下の線形回帰式を推定する。
Avg_Points(i)=B(0)+B(1)Pass_Completed(i)+B(2)Avg_Reward(i)
Passes_Completedは分散の約53%を説明し、Pass_Rewardはさらに4%を説明する。
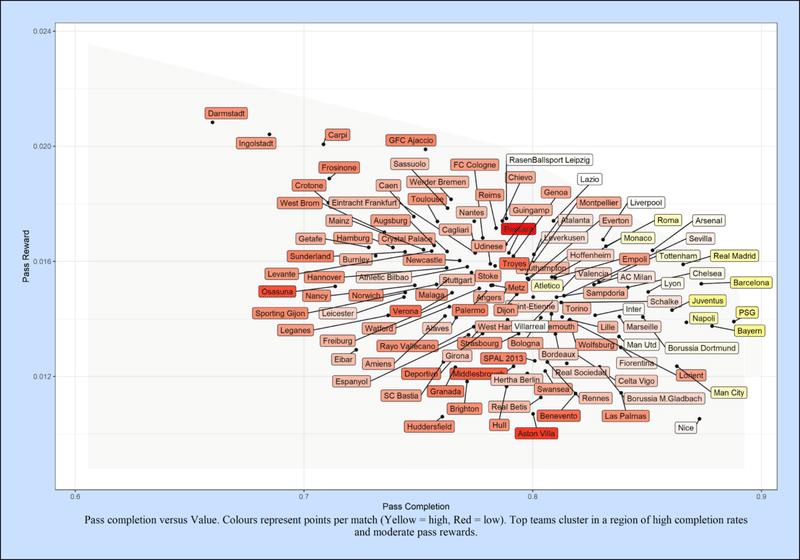
Well 4% is worth having when you’ve already explained 53%, but it isn’t earth shattering. Finally, the chart below illustrates the relationships between Pass Completion rates, Pass Reward rates and team performance in terms of points per match. High performing teams are shown in lighter colors and we can see they cluster in a region of high completion rates and moderate rewards. The difference between high and low performing teams doesn’t seem to be a matter of producing more aggressive passes. Manchester City stands out in fact as having a low Pass Reward rate.
すでに53%を説明したとき、4%は持つ価値があるがそれは大したことではない。最後に下のグラフは、1試合あたりの勝ち点に関するパス成功率、パス報酬、チーム成績の関係を示す。成績の高いチームは薄い色で表示されており、高いパス成功率と中程度の報酬の領域に集まっていることがわかる。パフォーマンスの高いチームと低いのチームの違いは、より積極的なパスを生み出すという問題ではないようである。マンチェスター・シティは、実際には低いパス報酬を持つことで際立つ。
Conclusion
Now we could probably extend or adapt the pass reward measure in various ways to increase its utility somewhat, for example by using xG instead of shots, or accounting for unsuccessful passes, but I doubt whether it would ever become a major factor in explaining team performance. For these reasons, I would be cautious about metrifying it at this stage; it may or may not be better than other measures of pass importance.
これで、シュートの代わりにxGを使用したり、失敗したパスを考慮に入れたりするなど、さまざまな方法でパス報酬の尺度を拡張または適応させることができるが、これがチームのパフォーマンスを説明する大きな要因になるのかは疑問である 。これらの理由から、この段階でそれを計量化することに慎重になる。それはパス重要性の他の尺度よりも良いかもしれないし、そうでないかもしれない。
But writing this post has made me realize that – in the public domain at least – we seem to be lacking information about the characteristics of the various metrics that have been developed to assess players, teams and performances. The analogy that springs to mind is psychology. A vast range of psychological scales has been developed to assess individual differences in the areas of ability, personality, values, preferences, temperament and so forth, and other sub-disciplines of psychology boast a similar forest of measures. When other scientists want to use a measure in their own research, they will look for minimum levels of reliability and validity, and some idea of the relationship between that measure and others (what Cronbach and Meehl called the nomological network). Something like this would be very useful in football. We should be clear what our metrics do and do not measure, and what their limitations are; we should not be in the business of assessing players on metrics whose properties we don’t understand.
しかし、この記事を書いて、少なくとも公共領域では、選手、チーム、そしてパフォーマンスを評価するために開発されたさまざまな指標の特性についての情報が不足しているように思われることがわかった。思い浮かぶのは心理学である。能力、人格、価値、嗜好、気質などの分野における個人差を評価するために、広範囲の心理学的尺度が開発されており、その他の心理学の下位分野でも同様の対策が施されている。他の科学者が自分たちの研究で尺度を使いたいと思うとき、彼らは最小レベルの信頼性と妥当性、そしてその尺度と他の尺度との関係についてのある考えを探すだろう(Cronbach氏とMeehl氏が法則定立的ネットワークと呼んだもの)。このようなものはフットボールで非常に役に立つ。測定基準が何をし、測定しないのか、そしてそれらの限界が何であるのかを明確にするべきである。その特性を理解していない指標で選手を評価するビジネスにはならないはずである。
Finally, to return to the question I began with, I don’t think this post solves the problem of why pass completion rates are so powerful as predictors of team success, and why high pass completers like Kroos are so prized. I thought I that the missing dimension was pass quality, and that the key to success was making “better” i.e. more aggressive passes. However, it seems that this is unlikely. Perhaps the missing dimension in all this is the way teams string passes together. I plan to look at this next.
最後に、最初の質問に戻ると、この記事ではなぜパス成功率がチームの成功を予測するのに非常に強力であるのか、そしてクロースのような高いパス成功者がそんなに高く評価されるのは解決しないと思う。欠けている次元はパス品質であり、成功への鍵は「より良い」、すなわちより積極的なパスを作ることであると思った。しかし、これはそうでもないようである。おそらくこれらすべてに欠けている次元は、チームが一緒にパスする方法である。次はこれを見ていくつもりである。
ここから先は
¥ 100
#フットボール統計学