フットボール統計学 期待値以上のパス方向性(DPOE)とパスソナー(PassSonar)とは何か 階層的クラスタリング

REINVENTING THE PASSING WHEEL: WHAT DETERMINES A GOOD PASSER? /OCTOBER 11, 2018 BY ELIOT MCKINLEY
Directional Passes Over Expected: Where do players exceed passing expectations?
During the National League Wildcard playoff game, American Soccer Analysis contributor and Lamar Hunt US Open Cup champion, Sean Steffen tweeted about the baseball stat Directional Outs Above Average. This metric tells you about the defensive range of an outfielder, with positive values indicating a direction where the player is better than average at creating an out and negative where the player is below average. Obviously, this exact type of metric cannot be used in soccer, but it did inspire me to figure out how something like it could be used. Thus, Directional Passes Over Expected (DPOE) was born.
ナショナルリーグのワイルドカードプレーオフゲームの頃、American Soccer Analysisの寄稿者およびLamar HuntのUS Open CupチャンピオンのSean Steffen氏が野球の統計Directional Outs Above Averageについてツイートした。この指標は、外野手の守備範囲について説明し、正の値はアウトを取るのに選手が平均よりも優れている方向を示し、選手が平均を下回ると負になる。明らかに、この指標と寸分違わぬものはフットボールで使用できないが、そのようなものがどのように使用されることができるかを理解することを私に刺激した。よって、期待値以上のパス方向性(Directional Passes Over Expected、DPOE)が生まれた。
DPOE aims to visualize where a player is good or bad at passing. Expected passes (xPass) gives a global measure of whether a player is better or worse than expected at completing his or her passes. However, some players are better in one direction or another. For example, if you know Lebron James is less likely to score driving to the hoop on his left, you plan your defense to make his go left. If you know that an opponent is a less accurate passer to his right, maybe you gameplan such that that player is forced to do so.
DPOEは、選手が得意、不得意なパスの方向を視覚化することを目的とする。パス期待値(xPass)は、選手が自分のパスを完了したときに予想よりも優れているか悪いかを示すグローバルな指標である。しかし、何人かの選手は特定の方向に優れている。例えば、Lebron Jamesが左に運ぶ可能性が低いとわかっている場合は、彼が左に行くために守備を計画する。もし相手の右へのパスが正確でないことを知っているなら、多分その選手がそうすることを強いられるようにゲームプランを組む。
Like its baseball inspiration, DPOE breaks up the players’ directionality into six slices of 60° each. For each sector, the players’ Per100 is shown. Per100 is defined as the number of passes a player completes compared to the number of expected passes normalized to 100 passes. So a Per100 of three indicates that a player is likely to complete three more passes in 100 than would be expected. It is derived from the xPass model developed by Matthias Kullowatz and is available on the interactive tables.
野球のインスピレーションのように、DPOEは選手の方向性をそれぞれ60度ごとの6つのスライスに分割する。各部門について、選手のPer100が表示される。Per100は、100パスに正規化された、パス期待値と比較した選手が完了したパス数として定義される。よって、Per100が3の場合、選手は期待値よりも100回で3回多くのパスを完了する可能性が高いことを示す。これはMatthias Kullowatz氏によって開発されたパス期待値モデルから派生したもので、対話式表で利用できる。
xPass takes into account numerous parameters to calculate the likelihood of pass success including the spatial location, whether it is a long ball, pass types, and whether a team is up or down a player. A good passer will have a Per100 greater than zero, an average passer will have a Per100 equal to zero, and a bad passer will be below zero. DPOE contextualizes Per100 by indicating in which direction a player is particularly good, average, or bad at completing passes.
パス期待値は空間的な位置、ロングボールかどうか、パスの種類、チームが選手の上にいるか下にあるかなど、パス成功の可能性を計算するために多数のパラメーターを考慮に入れる。良いパサーは0より大きいPer100を持ち、平均的なパサーは0に等しいPer100を持ち、悪いパサーは0未満になる。DPOEは、パスの完了時に選手がどの方向で特に優れているか、平均的であるか、または悪いかを示すことによってPer100を文脈化する。
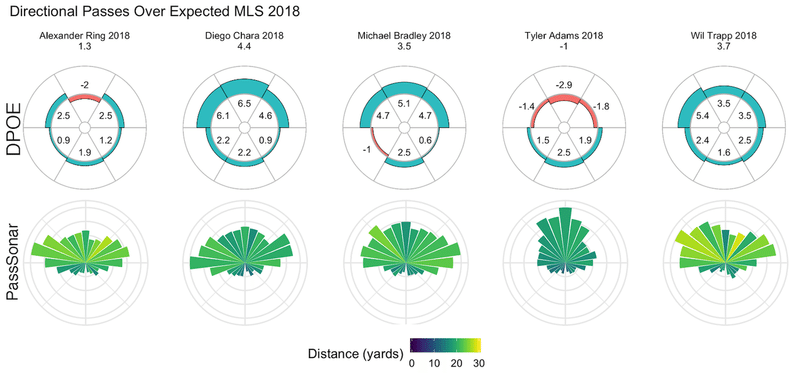
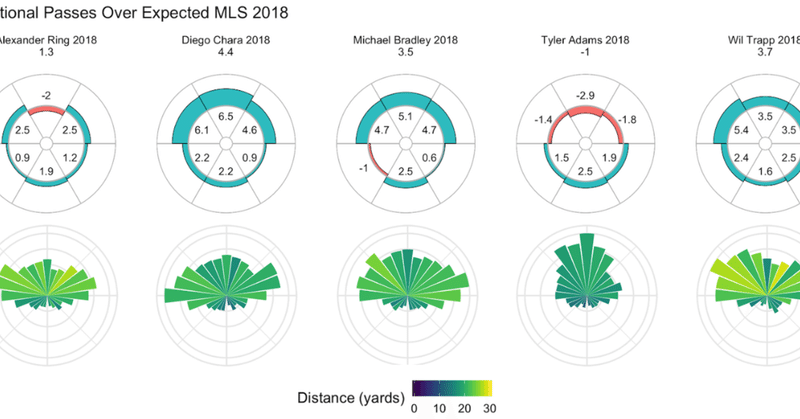
Let’s look at some examples of central defensive midfielders during the 2018 MLS season. The top row shows the DPOE plots with overall player Per100 labelled, and PassSonar plots on bottom (bars are pass angle frequencies, colors are pass distance) for Alexander Ring, Diego Chara, Michael Bradley, Tyler Adams, and Wil Trapp.
2018年MLSシーズン中の中央守備的なMFの例をいくつか見てみよう。アレクサンデル・リング、ディエゴ・チャラ、マイケル・ブラッドリー、タイラー・アダムズ、そしてウィル・トラップのDPOEプロット(上、全方向のPer100ラベル付き)と、パスソナープロット(下、棒はパス角度の頻度、色はパス距離)を示す。
DPOE plots show that Chara and Trapp are above average passers in all directions, however PassSonar shows that Trapp is a bit more likely to hit long diagonal balls than Chara. Ring and Bradley are above average in all sectors but one, with Ring below average straight ahead and Bradley towards the lower left. Perhaps if you were an opposition scout you may try to force them to play passes in these lower conversion rate directions. Finally there is Adams, who, playing for New York Red Bulls, plays much more direct than the other players depicted here in his PassSonar. Overall, his Per100 is lower than the other midfielders and his DPOE plot shows lower than average conversion rates in for forward passes.
DPOEプロットはチャラとトラップが全方向で平均的なパサーを上回っていることを示すが、パスソナーはトラップがチャラよりも長い斜めのボールを出す可能性が少し高いことを示す。リングとブラッドリーは1つを除く全てのセクターで平均を上回っており、リングは前方向、ブラッドリーは左左後方で平均を下回った。もし相手のスカウティングだったなら、彼らにこれらのより低い変換率の方向にパスを出させることを試みるかもしれない。最後に、ニューヨーク・レッドブルズでプレーするアダムズは、パスソナーでここに描かれている他の選手よりはるかにダイレクトである。全体として、彼のPer100は他のMFよりも低く、彼のDPOEプロットは前方向のパスで平均よりも低い変換率を示す。
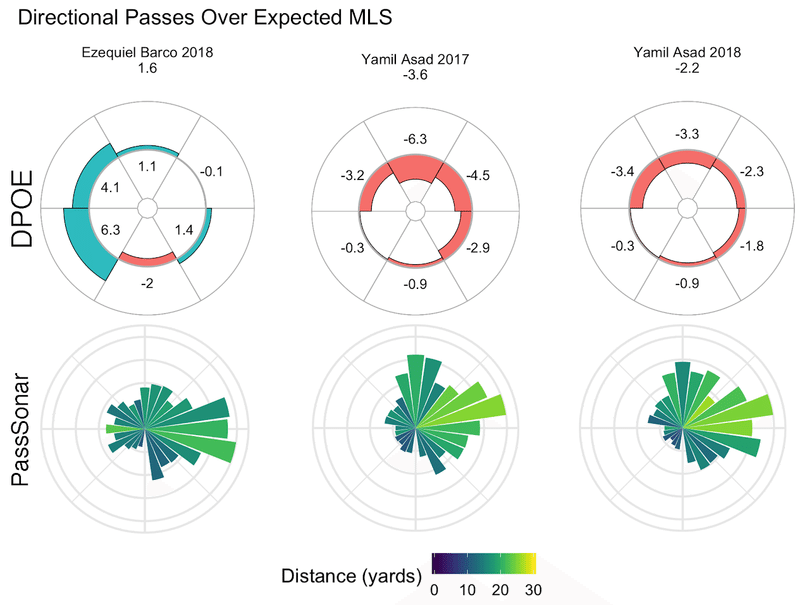
Lastly, let’s compare Ezequiel Barco and Yamil Asad. This past offseason, Asad was swapped one United for another moving from Atlanta to D.C. for around $500,000 in allocation money while Barco was signed from Independiente for a reported MLS record fee of $15 million. By DPOE, Barco is clearly the better passer. He has positive Per100 in most sectors, and is only far below expected passing directly backwards. Asad, however has had negative Per100 in all directional sectors since 2017. PassSonar demonstrates different passing patterns for the players as well. Barco predominately passes laterally to his right, with relatively few vertical passes. Asad also mostly passes to his right, but these passes are longer than Barco’s and Asad also plays a higher proportion of vertical passes.
最後に、エセキエル・バルコとヤミル・アサドを比較しよう。この過去のオフシーズンでは、アサドはアトランタ・ユナイテッドからD.C.ユナイテッドへ約50万ドルの配分金で移籍し、一方バルコはCAインデペンディエンテからアトランタ・ユナイテッドへ1500万ドルのMLS記録料で署名された。DPOEによると、バルコは明らかに優れたパサーである。彼はほとんどの分野で正のPer100を記録しており、唯一後方向で平均を下回るパス期待値である。しかしアサドは2017年以降、全ての方向でPer100が負になっている。パスソナーも選手の異なるパスパターンを示す。バルコは主に右横方向にパスし、垂直方向のパスは比較的少ない。アサドもほとんど右にパスするが、これらのパスはバルコよりも長く、アサドは垂直方向の割合も高くなる。
Barco and Asad are obviously different players when it comes to passing, which shows in Barco’s xA per 96 being double than that of Asad in 2018, while both are contributing a similar amount of expected goals. Much has been said about Barco being a disappointment both on the field and off, but his underlying numbers remain relatively strong, including co-leading the league in xGC/96 with Miguel Almiron. Whether Atlanta would have been better off paying the $1 million fee for a permanent Asad transfer instead of bringing in Barco is still an open question. However, given that Barco is 4.5 years younger, producing pretty good numbers while on the field, and still developing as a player, I’d hold off on answering that question definitively.
バルコとアサドは、パスに関して明らかに異なる選手であり、バルコの96分あたりのxAが2018年のアサドの2倍であることを示す。バルコがオンでもオフでも失望していることについて多くのことが言われているが、96分あたりのxGCでMiguel Almironとリーグをリードするなど、彼の基本的な数字は比較的強いままである。アトランタがバルコを買収するのではなく、アサドの恒久的な送金に100万ドルの料金を支払ったほうがよいかどうかは、未解決の問題である。しかし、バルコは4、5歳若く、ピッチでかなりの数を生み出し、選手として成長途中なので、その質問に最終的に答えるのを差し控えたい。
There are some inherent limitations of DPOE, such as small sample sizes on some directions (e.g. Nick Rimando has a backwards Per100 of 81 by completing 1 backwards pass this season), and perhaps there should be more directional bins. Additionally, the xPass model has some limitations which have been outlined by Matthias, which includes undetermined confounding factors due to player position, game states, and potentially playing styles. As such, when comparing players with DPOE one should be careful to take these limitations into account. But even given these, DPOE provides a means of assessing where a player passes well or poorly, and perhaps where a player should focus on in training or identifying weaknesses that an opposing team could exploit.
DPOEには固有の制限がいくつかあり、例えばいくつかの方向でサンプルサイズが小さい場合(例えばニック・リマンドは今シーズン1回の後方向パスを完了することによって81のPer100を持つ)や、そしておそらくもっと多くの方向のビンがあるはずである。さらにxPassモデルには、Matthiasによって概説されている制限がいくつかあり、これには選手の位置、試合の状態、および潜在的なプレースタイルによる未確定の交絡因子が含まれる。そのため、選手をDPOEで比較するときは、これらの制限を考慮に入れるように注意する必要がある。しかしこれらを考慮しても、DPOEは選手がどこでパスしを成功または失敗したのかを評価する手段を提供し、そしておそらく選手がトレーニングで集中すべき場所、または相手チームが悪用する可能性のある弱点を特定する。
----------
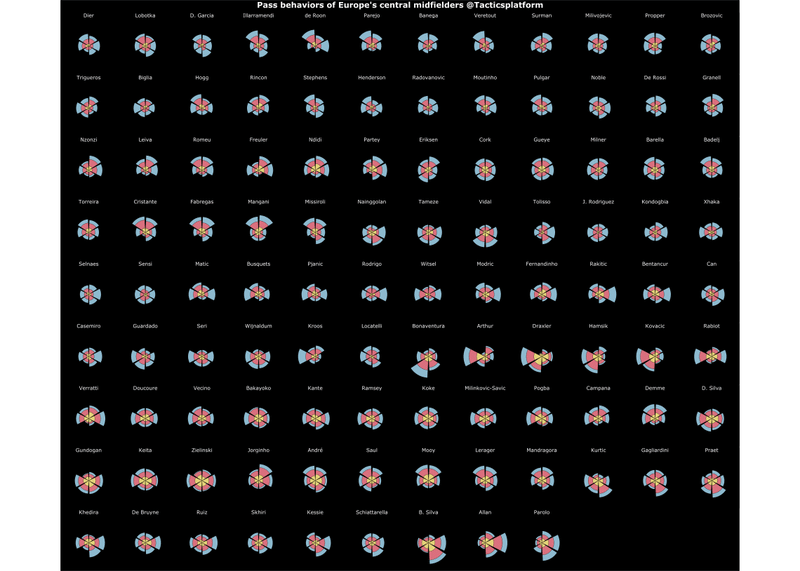
Finding similarity of Europe central midfielder’s pass behavior by hierarchical clustering
階層的クラスタリングによるヨーロッパのセンターMFのパス行動の類似性の発見
ここから先は
¥ 100
#フットボール統計学