
(MT4)無料で使えるインジケータ「移動平均線乖離率」+MQL4コード

MT4上で使える「移動平均線乖離率」を作成しました。
インジケータとしては「エンベロープ」の方がメジャーだと思います。
役割としてはそこまで大差ないですが、「エンベロープ」がチャート上に表示されるものに対して、「移動平均線乖離率」はオシレータとして使うことができます。
移動平均線乖離率について
移動平均乖離率は、株式投資の株価分析やFXの分析など含め、世界で最もポピュラーなテクニカル分析である移動平均線(一定期間における終値の平均値の変化をグラフで表したインジゲーター)から値段がどれだけ離れているかを簡単に数値化し、割合で表したテクニカル分析です。一般的にはオシレーター系のテクニカル分析となります。類似のテクニカル分析として、移動平均乖離率をチャートに重ねたエンベロープなどがあります。
引用元:移動平均乖離率とは?FXで買われすぎ・売られすぎを判断する方法
他のツール上でタダで使えるツールをわざわざ有料で公開する理由もないので、こちらは無料で使えるようにしております。ページ下部よりダウンロードできるので、使いたい方はぜひ使ってみてください。
こちらのインジケータでは、移動平均線乖離率を最大3本まで表示できます。
MT4にデフォルトで備わっている他インジケータのようにシンプルなもので、移動平均線乖離率以外の機能は特にありません。
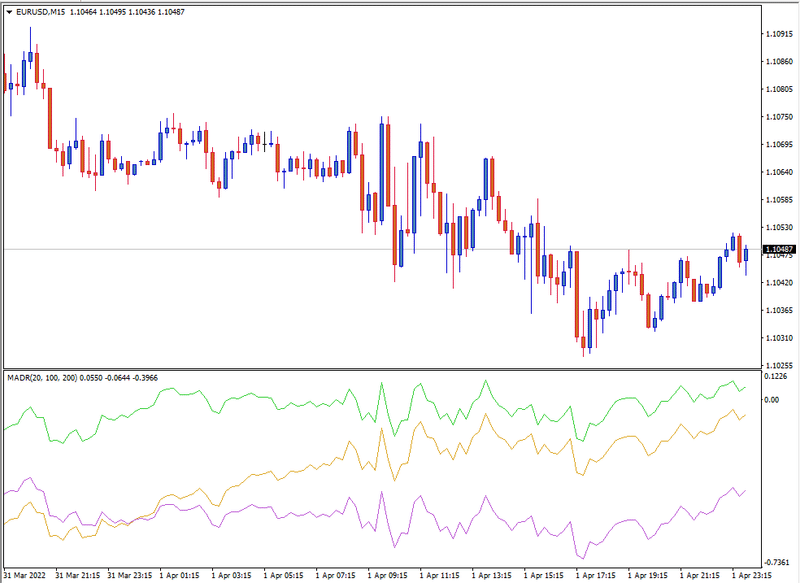
商品説明としては画像の通りとなります。特に語ることは特別ないかなと。
具体的な計算方法ですが、下記の通りとなります。
式:{(実価格 ー 移動平均線の価格)/ 移動平均線の価格}x100
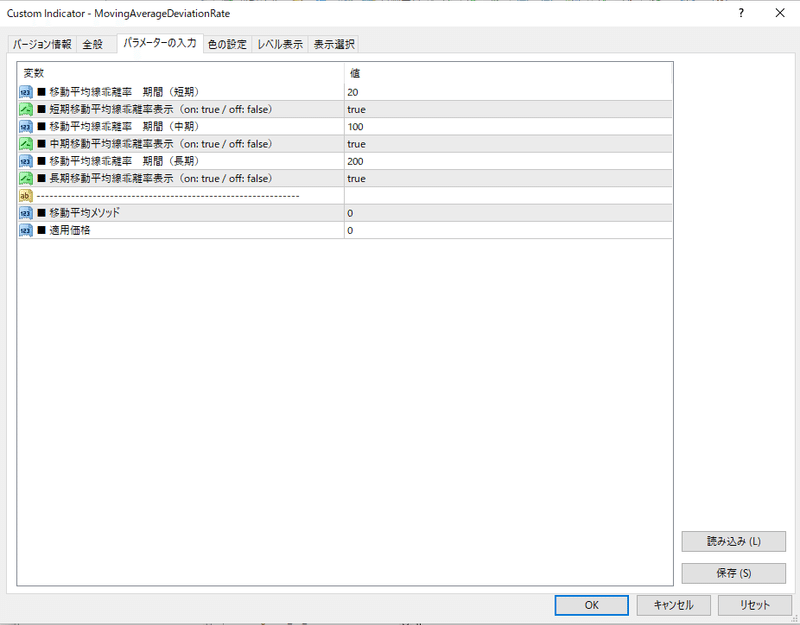
パラメータ設定としては、3種類の期間また表示のオンオフを設定することができます。
移動平均メソッドについては、以下の通りに設定可能です。
0:単純移動平均
1:指数移動平均
2:平滑移動平均
3:加重移動平均
適用価格については、以下の通りに設定可能です。
0:終値
1:始値
2:高値
3:安値
4:中間値 (高値 + 安値)/2
5:平均値1 (高値 + 安値 + 終値)/3
6:平均値2 (高値 + 安値 + 終値 + 終値)/4
ダウンロード
こちらは↓より無料でDLしてお使いいただけます。
■ファイルの格納先
ex4ファイルの格納先は、以下の手順で格納してください。
① MT4を開き、MT4画面左上の「ファイル」より「データフォルダを開く」を選択。
②フォルダが開かれるので、「MQL4」のフォルダへ移動。
③「MQL4」のフォルダ内にある「Indicators」を開き、ここへex4ファイルを格納する。
MT4再起動後、.ex4ファイルが読み込まれていることを確認する。
MQL4のコードについては無料コンテンツとして公開しております。
MQLの学習にお役立てください。
MQL4コード
//+------------------------------------------------------------------+
//|                                   MovingAverageDeviationRate.mq4 |
//|                                            Copyright 2022, じゅにこ. |
//|                            https://coconala.com/services/2119358 |
//+------------------------------------------------------------------+
#property copyright "Copyright 2022, じゅにこ."
#property link      "https://coconala.com/services/2119358"
#property version   "1.00"
#property strict
#property indicator_separate_window
#property indicator_buffers 3
#property indicator_plots   3
//--- plot Label_short
#property indicator_label1  "Label_short"
#property indicator_type1   DRAW_LINE
#property indicator_color1  clrLimeGreen
#property indicator_style1  STYLE_SOLID
#property indicator_width1  1
//--- plot Label_middle
#property indicator_label2  "Label_middle"
#property indicator_type2   DRAW_LINE
#property indicator_color2  clrGoldenrod
#property indicator_style2  STYLE_SOLID
#property indicator_width2  1
//--- plot Label_long
#property indicator_label3  "Label_long"
#property indicator_type3   DRAW_LINE
#property indicator_color3  clrMediumOrchid
#property indicator_style3  STYLE_SOLID
#property indicator_width3  1
//--- indicator buffers
double         Label_shortBuffer[];
double         Label_middleBuffer[];
double         Label_longBuffer[];

input int short_period = 20;     // ■ 移動平均線乖離率 期間(短期)
input bool short_on = true;      // ■ 短期移動平均線乖離率表示(on: true / off: false)
input int middle_period = 100;   // ■ 移動平均線乖離率 期間(中期)
input bool middle_on = true;     // ■ 中期移動平均線乖離率表示(on: true / off: false)
input int long_period = 200;     // ■ 移動平均線乖離率 期間(長期)
input bool long_on = true;       // ■ 長期移動平均線乖離率表示(on: true / off: false)
input string a;                  //-------------------------------------------------------------
input int MA_Method = 0;         // ■ 移動平均メソッド
input int Applied_Price = 0;     // ■ 適用価格

//+------------------------------------------------------------------+
//| Custom indicator initialization function                         |
//+------------------------------------------------------------------+
int OnInit()
 {
//--- indicator buffers mapping
  SetIndexBuffer(0,Label_shortBuffer);
  SetIndexBuffer(1,Label_middleBuffer);
  SetIndexBuffer(2,Label_longBuffer);

  SetIndexLabel(0,"MADR");
  IndicatorShortName("MADR(" + short_period + ", " + middle_period + ", " + long_period + ")");

//---
  return(INIT_SUCCEEDED);
 }
//+------------------------------------------------------------------+
//| Custom indicator iteration function                              |
//+------------------------------------------------------------------+
int OnCalculate(const int rates_total,
               const int prev_calculated,
               const datetime &time[],
               const double &open[],
               const double &high[],
               const double &low[],
               const double &close[],
               const long &tick_volume[],
               const long &volume[],
               const int &spread[])
 {
//---
  if(Bars < MathMax(long_period,MathMax(short_period,middle_period)))
    {
     return(0);
    }
  for(int icount = 0; icount <= Bars - MathMax(long_period,MathMax(short_period,middle_period)); icount++)
    {
     if(short_on == true)
       {
        Label_shortBuffer[icount] = iMADR(NULL,0,short_period,icount);
       }
     if(middle_on == true)
       {
        Label_middleBuffer[icount] = iMADR(NULL,0,middle_period,icount);
       }
     if(long_on == true)
       {
        Label_longBuffer[icount] = iMADR(NULL,0,long_period,icount);
       }
    }
//--- return value of prev_calculated for next call
  return(rates_total);
 }
//+------------------------------------------------------------------+

//+------------------------------------------------------------------+
//|                                                                  |
//+------------------------------------------------------------------+
double iMADR(const string symbol, int timeframe, int period, int index)
 {

  double MA = iMA(symbol,timeframe,period,0,MA_Method,Applied_Price,index);
  if(MA != 0)
    {
     double MADR = ((iClose(symbol,timeframe,index) - MA) / MA) * 100;
     return(MADR);
    }
  else
    {
     return(NULL);
    }
 }
//+------------------------------------------------------------------+
コード解説
移動平均線乖離率は「iMA()」のようにMQL4では関数として備わっていないので、別途切り出して「iMADR()」として関数を作成しています。
「if(MA != 0)」によって条件を分けている理由としては分母に「MA(移動平均線)」を計算に使うためです。「0」だと割り算できなくなってしまい、MT4上でエラーとなり表示されなくなってしまいます。
この記事が気に入ったらサポートをしてみませんか?