
Pythonライブラリ(AutoML):Lazypredict

1.概要
「Pythonライブラリ(AutoML):PyCaret」と同様に、Lazypredictは多数のライブラリ・フレームワーク(機械学習:scikit-learn、XGBoostなど、パラメータ調整:Optunaなど、可視化:SHAPなど)のPythonラッパーです。
Lazypredictを用いることで複数モデルでの学習・推論をまとめて比較でき最適な機械学習モデルの選定・学習が可能となります(AUTOML)。
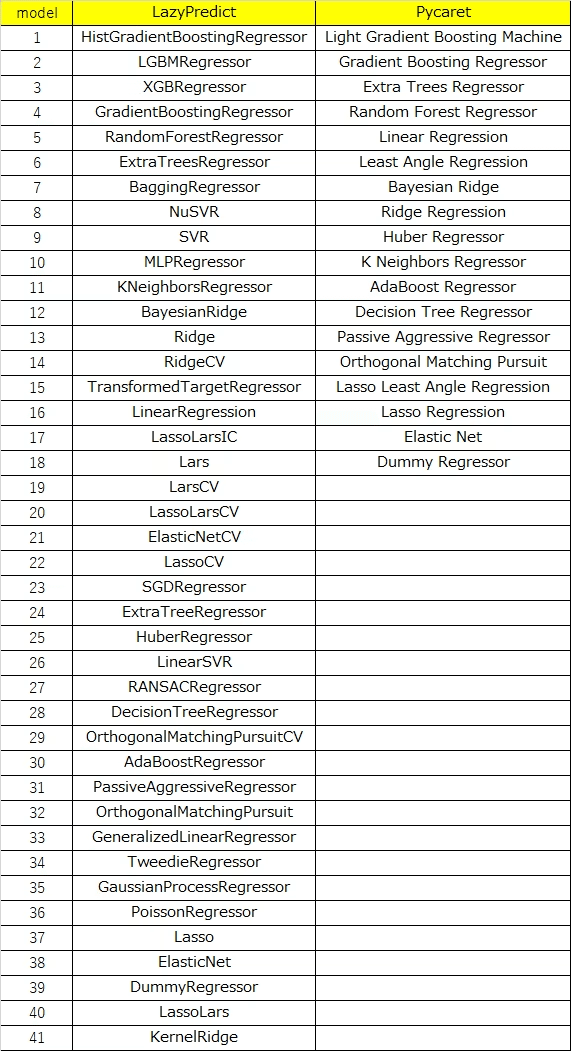
1-1.PyCaret Vs Lazypredictの比較
「Qiita:たった2行で機械学習手法を選定!」より,Lazypredictの方がモデル数は多いとのことです。ただし自分が全く理解できていないモデルを採用するのはモデルの適用範囲から外れる可能性があるため注意が必要です。
1-2.サンプル用データ(回帰・分類)
各サンプル用データは下記の通りです(各種ライブラリは下記参照)。
【分類(Classification)】
Irisの分類問題
[IN]
import numpy as np
import pandas as pd
import matplotlib.pyplot as plt
import japanize_matplotlib
import seaborn as sns
from sklearn import datasets
iris = datasets.load_iris()
x_iris, target = iris.data, iris.target
print(f'data shape: {x_iris.shape}, target shape: {target.shape}')
print(f'1個目のデータ: {x_iris[0]}、ラベル: {target[0]}')
columns = iris.feature_names + ['target']
iris_data = np.concatenate([x_iris, target.reshape(-1, 1)], axis=1)
df_iris = pd.DataFrame(iris_data, columns=columns)
display(df_iris)
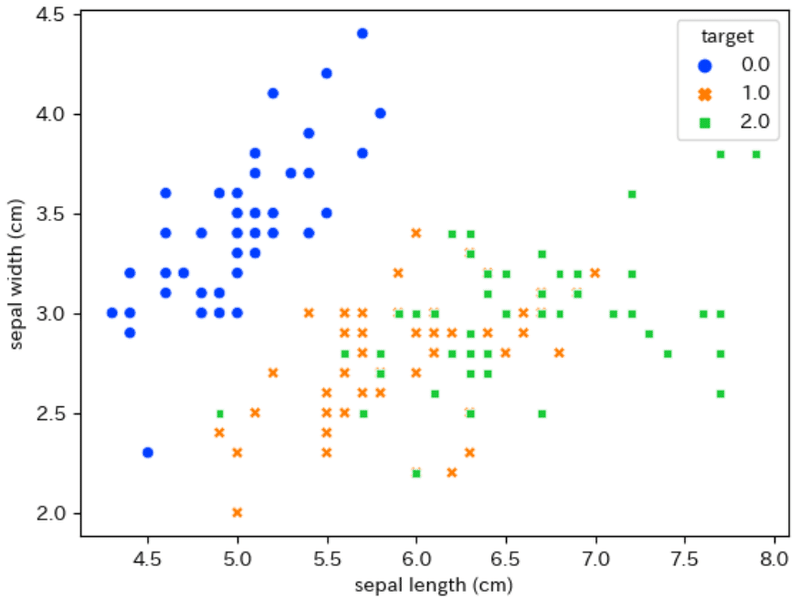
sns.scatterplot(x='sepal length (cm)', y='sepal width (cm)', data=df_iris,
hue='target', style='target', palette='bright')
[OUT]
data shape: (150, 4), target shape: (150,)
1個目のデータ: [5.1 3.5 1.4 0.2]、ラベル: 0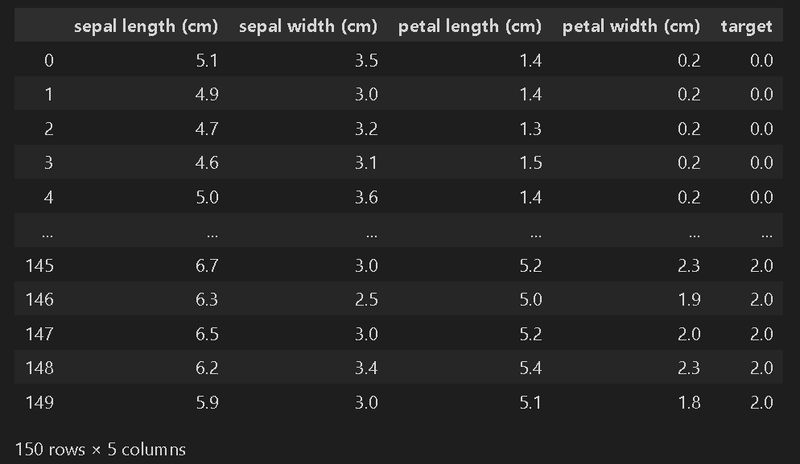
【回帰(Regression)】
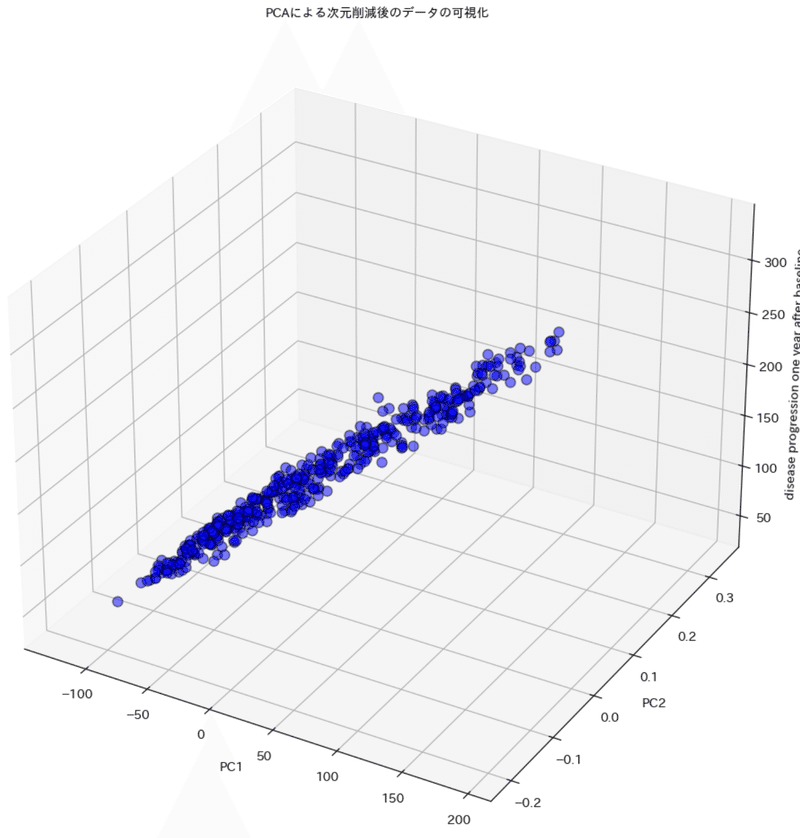
Diabetesの病気の進行度
[IN] #Regression
diabetes = datasets.load_diabetes()
x_diabetes, target = diabetes.data, diabetes.target
print(f'data shape: {x_diabetes.shape}, target shape: {target.shape}')
print(f'1個目のデータ: {x_diabetes[0]}、ラベル: {target[0]}')
columns = diabetes.feature_names + ['target']
diabetes_data = np.concatenate([x_diabetes, target.reshape(-1, 1)], axis=1)
df_diabetes = pd.DataFrame(diabetes_data, columns=columns)
display(df_diabetes)
 #次元削減して可視化
from sklearn.decomposition import PCA
from mpl_toolkits.mplot3d import Axes3D
pca = PCA(n_components=2) #主成分分析 (2次元に圧縮)
pca.fit(df_diabetes)
x_pca = pca.transform(df_diabetes) #PCA変換 :出力はndarray
 #3Dプロット
fig = plt.figure(figsize=(12, 12), facecolor='w')
ax = fig.add_subplot(111, projection='3d')

ax.set_title('PCAによる次元削減後のデータの可視化', fontsize=10)
ax.set_xlabel('PC1', fontsize=10)
ax.set_ylabel('PC2', fontsize=10)
ax.set_zlabel('disease progression one year after baseline', fontsize=10)

x, y, z = x_pca[:, 0], x_pca[:, 1], df_diabetes['target']
ax.plot(x, y, z, 'o', markersize=8, color='blue', alpha=0.5, markeredgecolor='k')
plt.show()

[OUT]
data shape: (442, 10), target shape: (442,)

1個目のデータ: [ 0.03807591  0.05068012  0.06169621  0.02187239 -0.0442235  -0.03482076
 -0.04340085 -0.00259226  0.01990749 -0.01764613]、ラベル: 151.0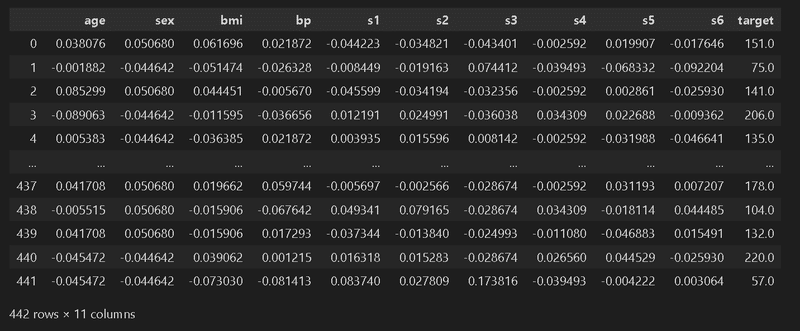
2.環境構築
2-1.仮想環境の作成
初めに他環境に影響がでないようにAnacondaで仮想環境を作成しました。
[TERMINAL]
conda create -n lazypredict python
activate lazypredict
conda info -e

[OUT]
# conda environments:
#
base                     C:\Users\KIYO-\anaconda3
lazypredict           *  C:\Users\KIYO-\anaconda3\envs\lazypredict
stylegan3                C:\Users\KIYO-\anaconda3\envs\stylegan3
なお仮想環境が分からない という人は、仮想環境を作成せずColabを使用するのも一つの手だと思います。
2-2.ライブラリのインストール
必要なライブラリをインストールします。
[Terminal]
pip install lazypredict3.Lazypredict用の前処理
Lazypredictを使用するために必要な処理を記載します。ただし、一般的なモデルにも必要な内容のためLazypredictを使用することによる負担増はありません。
外れ値・欠損値の処理
学習・検証(テスト)用のデータへの分割
1つ目の「外れ値・欠損値の処理」いわゆる前処理であり「特徴量エンジニアリング」の一部となります。こちらは「Matplotlib・Seaborn」による可視化や「Numpy・Pandas」による統計値取得・データ処理などがありますが、解析者のドメイン知識なども使用しながら実施します。
2つ目はLazypredictでは”model.fit(X_train, X_test, y_train, y_test)”のように、学習時に検証用データも合わせて渡すためデータを事前に分割する必要があります。
こちらはscikit-learnの”train_test_split”などがオススメです。
4.Lazypredictの実装(分類)
Lazypredictでの分類問題は”LazyClassifier”を使用します。まずはサンプルデータ読み込み+分割を実施しました。
[IN]
iris = datasets.load_iris()
x_iris, target = iris.data, iris.target
print(f'分類用データ: X:{x_iris.shape}, {type(x_iris)}, y:{target.shape}, {type(target)})}}')
 #データ分割
from sklearn.model_selection import train_test_split
X_train, X_test, y_train, y_test = train_test_split(x_iris, target, test_size=0.2, random_state=42)
print(f'X_train shape: {X_train.shape}, X_test shape: {X_test.shape}, y_train shape: {y_train.shape}, y_test shape: {y_test.shape}')

[OUT]
分類用データ: X:(150, 4), <class 'numpy.ndarray'>, y:(150,), <class 'numpy.ndarray'>)}
X_train shape: (120, 4), X_test shape: (30, 4), y_train shape: (120,), y_test shape: (30,)実際の学習コードは下記2行となります。
[IN]
from  lazypredict.Supervised import LazyClassifier
lazyclf = LazyClassifier(verbose=0, ignore_warnings=True, custom_metric=None)
models, predictions = lazyclf.fit(X_train, X_test, y_train, y_test)

models

[OUT]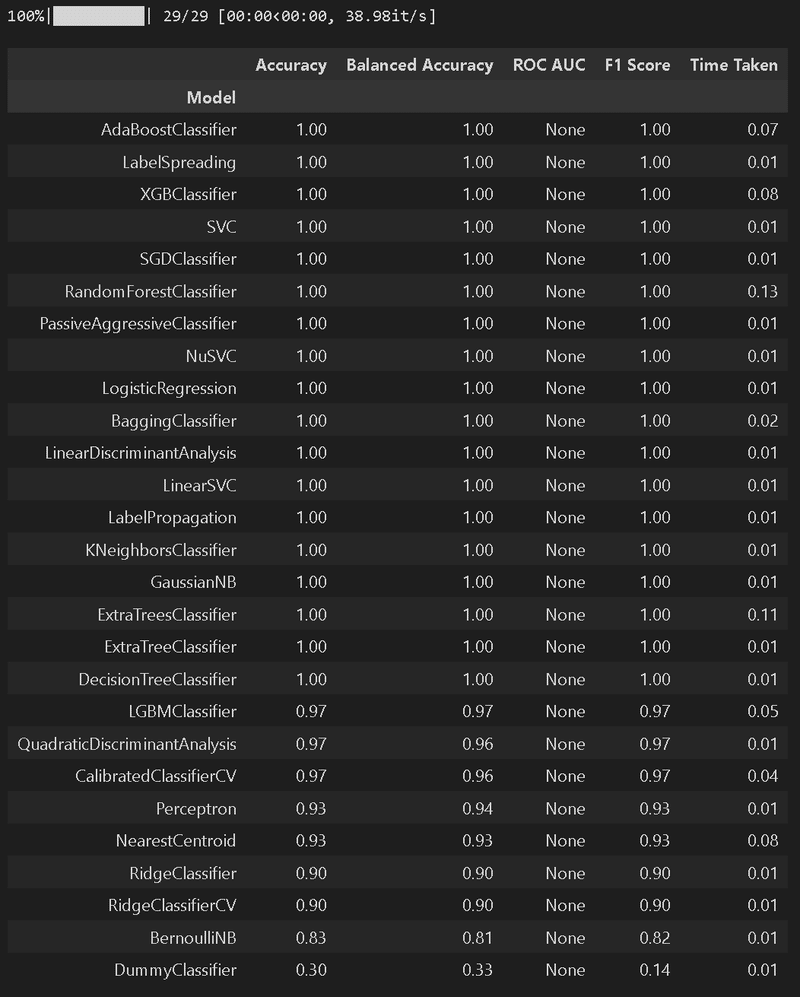
【出力結果の詳細確認】
とりあえずモデル一覧は出ましたが、ここからどうする(モデルの抽出方法やアンサンブルなど)のかがわからないのでとりあえず属性一覧を出力しました。
なお私のVersion?ではなぜかpredictとmodelsは同じ出力結果となりました。
[IN]
print(type(models), type(predictions))
print([i for i in dir(models) if not i.startswith('_')])

[OUT]
<class 'pandas.core.frame.DataFrame'> <class 'pandas.core.frame.DataFrame'>

['Accuracy', 'T', 'abs', 'add', 'add_prefix', 'add_suffix', 'agg', 'aggregate', 'align', 'all', 'any', 'append', 'apply', 'applymap', 'asfreq', 'asof', 'assign', 'astype', 'at', 'at_time', 'attrs', 'axes', 'backfill', 'between_time', 'bfill', 'bool', 'boxplot', 'clip', 'columns', 'combine', 'combine_first', 'compare', 'convert_dtypes', 'copy', 'corr', 'corrwith', 'count', 'cov', 'cummax', 'cummin', 'cumprod', 'cumsum', 'describe', 'diff', 'div', 'divide', 'dot', 'drop', 'drop_duplicates', 'droplevel', 'dropna', 'dtypes', 'duplicated', 'empty', 'eq', 'equals', 'eval', 'ewm', 'expanding', 'explode', 'ffill', 'fillna', 'filter', 'first', 'first_valid_index', 'flags', 'floordiv', 'from_dict', 'from_records', 'ge', 'get', 'groupby', 'gt', 'head', 'hist', 'iat', 'idxmax', 'idxmin', 'iloc', 'index', 'infer_objects', 'info', 'insert', 'interpolate', 'isetitem', 'isin', 'isna', 'isnull', 'items', 'iteritems', 'iterrows', 'itertuples', 'join', 'keys', 'kurt', 'kurtosis', 'last', 'last_valid_index', 'le', 'loc', 'lookup', 'lt', 'mad', 'mask', 'max', 'mean', 'median', 'melt', 'memory_usage', 'merge', 'min', 'mod', 'mode', 'mul', 'multiply', 'ndim', 'ne', 'nlargest', 'notna', 'notnull', 'nsmallest', 'nunique', 'pad', 'pct_change', 'pipe', 'pivot', 'pivot_table', 'plot', 'pop', 'pow', 'prod', 'product', 'quantile', 'query', 'radd', 'rank', 'rdiv', 'reindex', 'reindex_like', 'rename', 'rename_axis', 'reorder_levels', 'replace', 'resample', 'reset_index', 'rfloordiv', 'rmod', 'rmul', 'rolling', 'round', 'rpow', 'rsub', 'rtruediv', 'sample', 'select_dtypes', 'sem', 'set_axis', 'set_flags', 'set_index', 'shape', 'shift', 'size', 'skew', 'slice_shift', 'sort_index', 'sort_values', 'squeeze', 'stack', 'std', 'style', 'sub', 'subtract', 'sum', 'swapaxes', 'swaplevel', 'tail', 'take', 'to_clipboard', 'to_csv', 'to_dict', 'to_excel', 'to_feather', 'to_gbq', 'to_hdf', 'to_html', 'to_json', 'to_latex', 'to_markdown', 'to_numpy', 'to_orc', 'to_parquet', 'to_period', 'to_pickle', 'to_records', 'to_sql', 'to_stata', 'to_string', 'to_timestamp', 'to_xarray', 'to_xml', 'transform', 'transpose', 'truediv', 'truncate', 'tz_convert', 'tz_localize', 'unstack', 'update', 'value_counts', 'values', 'var', 'where', 'xs']
5.Lazypredictの実装(回帰)
Lazypredictでの分類問題は”LazyClassifier”を使用します。まずはサンプルデータ読み込み+分割を実施しました。
[IN] #Regression
diabetes = datasets.load_diabetes()
x_diabetes, target = diabetes.data, diabetes.target
print(f'回帰用データ: X:{x_diabetes.shape}, {type(x_diabetes)}, y:{target.shape}, {type(target)}')
 #データ分割
X_train, X_test, y_train, y_test = train_test_split(x_diabetes, target, test_size=0.2, random_state=42)
print(f'X_train shape: {X_train.shape}, X_test shape: {X_test.shape}, y_train shape: {y_train.shape}, y_test shape: {y_test.shape}')

[OUT]
回帰用データ: X:(442, 10), <class 'numpy.ndarray'>, y:(442,), <class 'numpy.ndarray'>

X_train shape: (353, 10), X_test shape: (89, 10), y_train shape: (353,), y_test shape: (89,)実際の学習コードは下記2行となります。結果はDataFrame型として出力されます。
[IN]
from lazypredict.Supervised import LazyRegressor
lazyreg = LazyRegressor(verbose=0, ignore_warnings=True, custom_metric=None)
models, predictions = lazyreg.fit(X_train, X_test, y_train, y_test)

models

[OUT]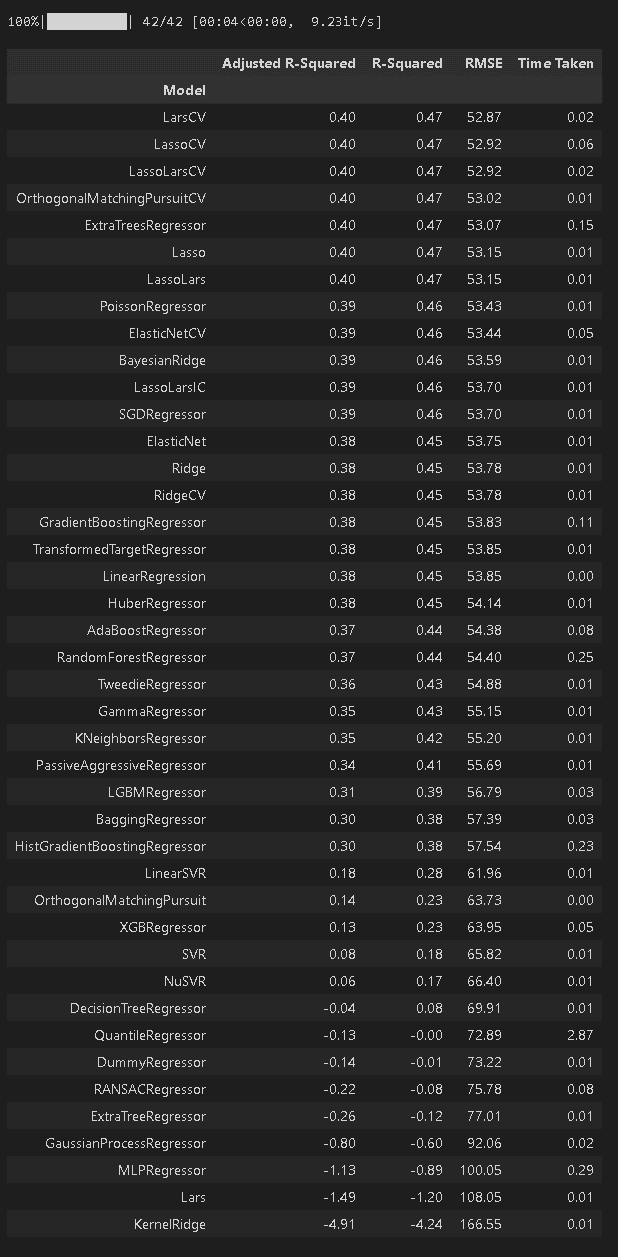
6.所感
結論としては「個人的にはPyCaretをメインで使うけど、精度が全然だったらlazypredictも試す」くらいだと思います。
PyCaretのようにAutoMLでベストモデル選択、アンサンブル、ハイパラ調整など様々なことが出来るわけではなく、モデルの一覧を出力するだけであり、どこまでハイパラ調整しているかもわからないため、あくまで”よさそうなモデルの選択”となります。
基本的な特性が同じであればある程度のモデルの方向性は分かるため、自分が理解できていないモデルがたくさんなくても十分だと感じました。また、ライブラリやDocumentの更新もなさそうなので、とりあえずは参考用レベルとして使っていきます。
7.エラー集
私が実施した時は特にエラーは発生しませんでしたがAutoMLは機械学習より環境構築が地獄となります。別の方でエラーが発生した内容を載せておきます。
参考記事
あとがき
期待していたけど、そこまででもなかったか・・・・・
この記事が気に入ったらサポートをしてみませんか?