
TradingViewのストラテジーを何も考えずに自動売買可能にするやり方

TradingViewの最新のpineスクリプトのバージョンに合わせて、なおかつもっとわかりやすく記事をリライトしました。(2019/11/15)
こちらをご覧ください。
==========以下以前の記事です==========
ProjectBBBです。
TradingViewには公式が公開している公開ストラテジーの他に、ユーザーが投稿しているストラテジーも山ほど存在しています。
本日は「このストラテジー良さそうだな」というストラテジーを、プログラミングができなくても何も考えずにその場ですぐに自動化する方法について書いていきます。
※仮想通貨自動売買プラットフォーム「はむすたー」を使ったやり方です。
pythonなどで書き換えて行うやり方については私はよくわかりません笑
また「はむすたー」を使っていない方でも、これを読めばストラテジーの売買タイミングでアラートを飛ばすやり方がわかるのでぜひ役に立てていただければと思います。
サンプルとして下記のストラテジーを使っていきます。
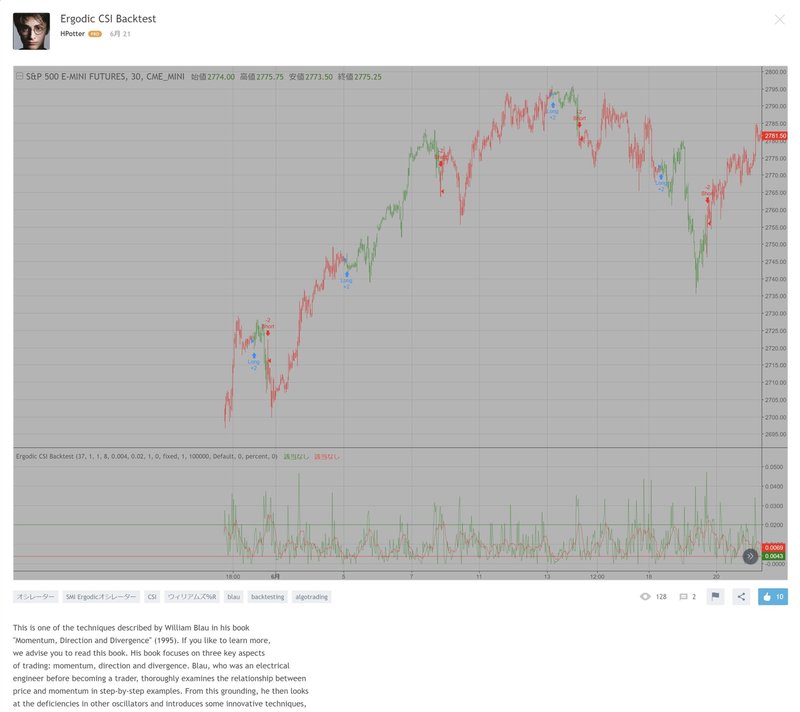
HPotterさんが6月21日に発表した「Egodis CSI Backtest」というストラテジーです。
このストラテジーを選んだ理由は特にありません!
(インチキストラテジーでないことだけは確認しています)
何でもできることを説明するために文字通りテキトーにチョイスしました。
さて、「はむすたー」を使った自動売買に必要なのはストラテジーのアラート化です。これ以外は一切不要です。
ストラテジーをアラート化するために、ストラテジーのソースコードを少し書き換えて、アラートを飛ばすためのコードに改造していきます。
まずこちらが「Egodis CSI Backtest」のソースコードです。
//@version=2
////////////////////////////////////////////////////////////
//  Copyright by HPotter v1.0 20/06/2018
// This is one of the techniques described by William Blau in his book
// "Momentum, Direction and Divergence" (1995). If you like to learn more,
// we advise you to read this book. His book focuses on three key aspects
// of trading: momentum, direction and divergence. Blau, who was an electrical
// engineer before becoming a trader, thoroughly examines the relationship between
// price and momentum in step-by-step examples. From this grounding, he then looks
// at the deficiencies in other oscillators and introduces some innovative techniques,
// including a fresh twist on Stochastics. On directional issues, he analyzes the
// intricacies of ADX and offers a unique approach to help define trending and
// non-trending periods.
// This indicator plots Ergotic CSI and smoothed Ergotic CSI to filter out noise.
//
// You can change long to short in the Input Settings
// WARNING:
// - For purpose educate only
// - This script to change bars colors.
////////////////////////////////////////////////////////////
fADX(Len) =>
   up = change(high)
   down = -change(low)
   trur = rma(tr, Len)
   plus = fixnan(100 * rma(up > down and up > 0 ? up : 0, Len) / trur)
   minus = fixnan(100 * rma(down > up and down > 0 ? down : 0, Len) / trur)
   sum = plus + minus
   100 * rma(abs(plus - minus) / (sum == 0 ? 1 : sum), Len)
strategy(title="Ergodic CSI Backtest")
r = input(32, minval=1)
Length = input(1, minval=1)
BigPointValue = input(1.0, minval=0.00001)
SmthLen = input(5, minval=1)
SellZone = input(0.004, minval=0.00001)
BuyZone = input(0.024, minval=0.001)
reverse = input(false, title="Trade reverse")
hline(BuyZone, color=green, linestyle=line)
hline(SellZone, color=red, linestyle=line)
source = close
K = 100 * (BigPointValue / sqrt(r) / (150 + 5))
xTrueRange = atr(1)
xADX = fADX(Length)
xADXR = (xADX + xADX[1]) * 0.5
nRes = iff(Length + xTrueRange > 0, K * xADXR * xTrueRange / Length,0)
xCSI = iff(close > 0,  nRes / close, 0)
xSMA_CSI = sma(xCSI, SmthLen)
pos = iff(xSMA_CSI > BuyZone, 1,
      iff(xSMA_CSI <= SellZone, -1, nz(pos[1], 0)))
possig = iff(reverse and pos == 1, -1,
         iff(reverse and pos == -1, 1, pos))
if (possig == 1)
   strategy.entry("Long", strategy.long)
if (possig == -1)
   strategy.entry("Short", strategy.short)
barcolor(possig == -1 ? red: possig == 1 ? green : blue )
plot(xCSI, color=green, title="Ergodic CSI")
plot(xSMA_CSI, color=red, title="SigLin")
英語がたくさん書いてあってよくわかんないですね!
それで大丈夫です!!
どのようなストラテジーなのかを理解することはとても大切なのですが、今回は自動化だけが目的なのですべて無視します。
今はコードの意味を考える必要はありません。
とりあえずこのコードをPineエディタにコピペして、チャート追加を押してみましょう。自動化とは関係ないですが成績は確認するだけ確認しておきます。
銘柄は、XBTUSD(BitMEX)
足の長さは、5分足
これで試してみます。
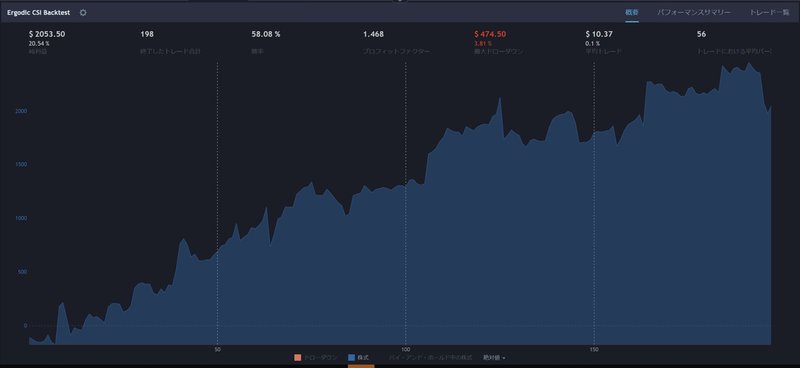
まあまあですね。
これは手数料なしのバックテスト結果なので、手数料込だと成績は落ちて少しだけプラスぐらいになります。
パラメータを変えれば化けるかもしれません。
ストラテジーをアラート化するために必要なポイントは3つです。
1. strategyをstudyに書き換える
2. plotshapeでアラートタイミングに印をつける
3. alertconditionでアラート化できるようにする
1. strategyをstudyに書き換える
まず1点目。
これはとても簡単です。
ソースコードの頭のほうにstrategyと書いてある項目があります。
これをstudyに書き換えます。
またstrategyが含まれている関数があればそれをすべて削除します。
strategy(title="Ergodic CSI Backtest")
       ↓
study(title="Ergodic CSI Backtest")
ソースコードの後ろのほうにもstrategy関数がありますが、これは後ほど。
2. plotshapeでアラートタイミングに印をつける
次に2点目。
これが一番面倒な箇所です。
売買のタイミングをチャート上に表示させます。
買うとき(ロング)の条件は何か、売るとき(ショート)の条件は何かをソースコードを見て見つけましょう。
大抵の場合ソースコードの下のほうにそれらしきものがあります。
if (possig == 1)
  strategy.entry("Long", strategy.long)
if (possig == -1)
  strategy.entry("Short", strategy.short)
ありました。
この strategy.entry というのがこのストラテジーでエントリーするときの条件を指定しています。
ここだと、if (possig == 1)のときにロング、if (possig == -1)のときにショートという条件になっています。
これを下のコードに挿入します。
plotshape(ロング, style=shape.labelup, color=green,  location=location.bottom, text="L", textcolor=white, title="LONG_ORDER")
plotshape(ショート, style=shape.labeldown, color=red, location=location.top, text="S", textcolor=white, title="SHORT_ORDER")
「ロング」「ショート」と書いてあるところに、それぞれ「possig == 1」「possig == -1」を当てはめていきます。
作ったものはstrategy.entryがあったところに差し込みます。
またこのタイミングでstrategy.entryの一連のコードは消してしまいましょう。
出来上がったコードは下記です。
//@version=2
fADX(Len) =>
   up = change(high)
   down = -change(low)
   trur = rma(tr, Len)
   plus = fixnan(100 * rma(up > down and up > 0 ? up : 0, Len) / trur)
   minus = fixnan(100 * rma(down > up and down > 0 ? down : 0, Len) / trur)
   sum = plus + minus
   100 * rma(abs(plus - minus) / (sum == 0 ? 1 : sum), Len)
study(title="Ergodic CSI Backtest")
r = input(32, minval=1)
Length = input(1, minval=1)
BigPointValue = input(1.0, minval=0.00001)
SmthLen = input(5, minval=1)
SellZone = input(0.004, minval=0.00001)
BuyZone = input(0.024, minval=0.001)
reverse = input(false, title="Trade reverse")
hline(BuyZone, color=green, linestyle=line)
hline(SellZone, color=red, linestyle=line)
source = close
K = 100 * (BigPointValue / sqrt(r) / (150 + 5))
xTrueRange = atr(1)
xADX = fADX(Length)
xADXR = (xADX + xADX[1]) * 0.5
nRes = iff(Length + xTrueRange > 0, K * xADXR * xTrueRange / Length,0)
xCSI = iff(close > 0,  nRes / close, 0)
xSMA_CSI = sma(xCSI, SmthLen)
pos = iff(xSMA_CSI > BuyZone, 1,
      iff(xSMA_CSI <= SellZone, -1, nz(pos[1], 0)))
possig = iff(reverse and pos == 1, -1,
         iff(reverse and pos == -1, 1, pos))
plotshape(possig == 1, style=shape.labelup, color=green,  location=location.bottom, text="L", textcolor=white, title="LONG_ORDER")
plotshape(possig == -1, style=shape.labeldown, color=red, location=location.top, text="S", textcolor=white, title="SHORT_ORDER")
barcolor(possig == -1 ? red: possig == 1 ? green : blue )
plot(xCSI, color=green, title="Ergodic CSI")
plot(xSMA_CSI, color=red, title="SigLin")
ここでチャートに追加を押していきます。
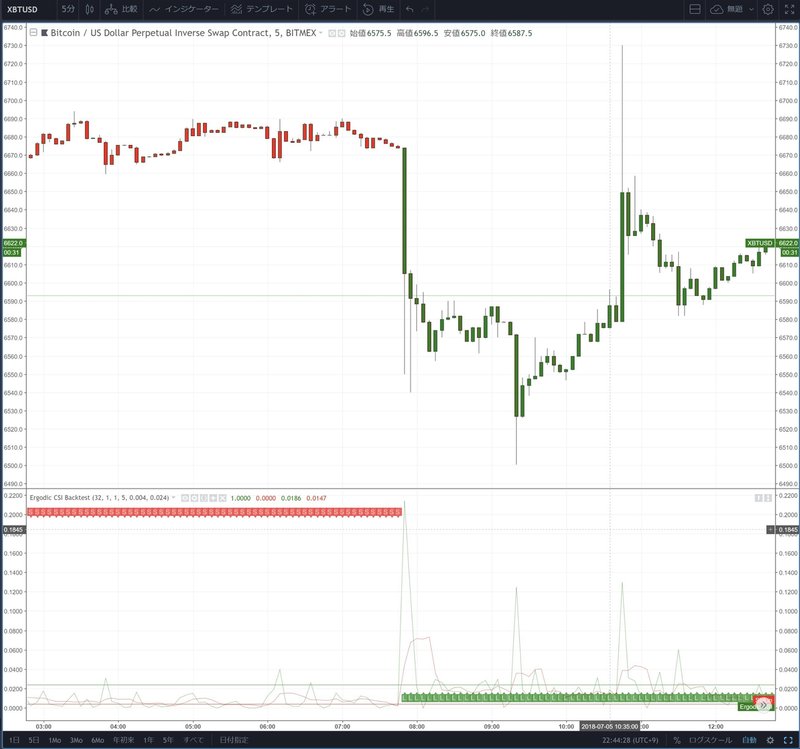
なんだか気持ち悪いことになってしまいましたね。
L(ロング)とS(ショート)のマークが大量に並んでしまっています。
一度買ったり売ったりしたら、次に反対売買するまでは売買を行わないようにしないと自動売買はできません。
Lが表示されたら次にSが表示がされるまでLの条件を満たしても無視する。
というコードを入れてあげればOKです。
それがこれです。
LONG = ++++++++++++++
SHORT = ++++++++++++++
POSITION = 0
LONG_ORDER = LONG and POSITION[1] != 1
SHORT_ORDER = SHORT and POSITION[1] != -1
POSITION := LONG_ORDER ? 1 : SHORT_ORDER ? -1 : nz(POSITION[1])
(はむすたーExectiveのまちゅけんさん作成)
ロングとショートの条件に先ほどの「possig == 1」「possig == -1」を当てはめます。
このコードで作った「LONG_ORDER」と「SHORT_ORDER」を先ほど「possig == 1」と「possig == -1」と記入したものと置き換えます。
//@version=2
study(title="Ergodic CSI Backtest")
fADX(Len) =>
   up = change(high)
   down = -change(low)
   trur = rma(tr, Len)
   plus = fixnan(100 * rma(up > down and up > 0 ? up : 0, Len) / trur)
   minus = fixnan(100 * rma(down > up and down > 0 ? down : 0, Len) / trur)
   sum = plus + minus
   100 * rma(abs(plus - minus) / (sum == 0 ? 1 : sum), Len)
r = input(32, minval=1)
Length = input(1, minval=1)
BigPointValue = input(1.0, minval=0.00001)
SmthLen = input(5, minval=1)
SellZone = input(0.004, minval=0.00001)
BuyZone = input(0.024, minval=0.001)
reverse = input(false, title="Trade reverse")
hline(BuyZone, color=green, linestyle=line)
hline(SellZone, color=red, linestyle=line)
source = close
K = 100 * (BigPointValue / sqrt(r) / (150 + 5))
xTrueRange = atr(1)
xADX = fADX(Length)
xADXR = (xADX + xADX[1]) * 0.5
nRes = iff(Length + xTrueRange > 0, K * xADXR * xTrueRange / Length,0)
xCSI = iff(close > 0,  nRes / close, 0)
xSMA_CSI = sma(xCSI, SmthLen)
pos = iff(xSMA_CSI > BuyZone, 1,
      iff(xSMA_CSI <= SellZone, -1, nz(pos[1], 0)))
possig = iff(reverse and pos == 1, -1,
         iff(reverse and pos == -1, 1, pos))
LONG = possig == 1
SHORT = possig == -1
POSITION = 0
LONG_ORDER = LONG and POSITION[1] != 1
SHORT_ORDER = SHORT and POSITION[1] != -1
POSITION := LONG_ORDER ? 1 : SHORT_ORDER ? -1 : nz(POSITION[1])
plotshape(LONG_ORDER, style=shape.labelup, color=green,  location=location.bottom, text="L", textcolor=white, title="LONG_ORDER")
plotshape(SHORT_ORDER, style=shape.labeldown, color=red, location=location.top, text="S", textcolor=white, title="SHORT_ORDER")
plot(xCSI, color=green, title="Ergodic CSI")
plot(xSMA_CSI, color=red, title="SigLin")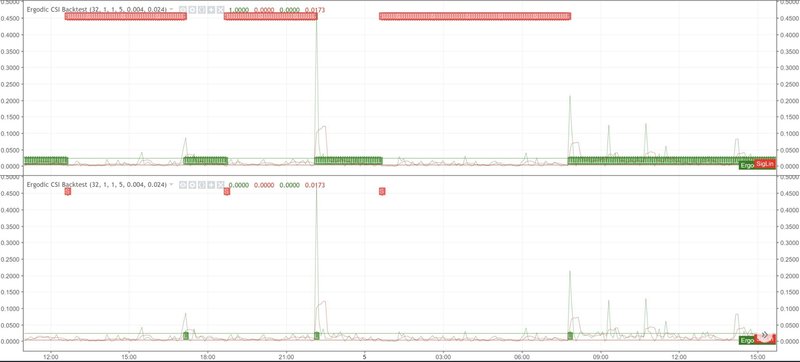
最初に作ったもの(上)と今作ったもの(下)を見比べると、LとSが交互に出てくれるようになったことがわかります。
3. alertconditionでアラート化できるようにする
最後です。
plotshapeという関数を使って売買タイミングをチャート上に描画しましたが、これだけだとアラート化はできません。
アラートを飛ばすための、alertconditionという関数を最後に付け加えてあげましょう。
alertcondition(ロング, title = "LONG_ALERT", message = ",HPotter_strategy,BUY,1,LONG")
alertcondition(ショート, title = "SHORT_ALERT", message = ",HPotter_strategy,SELL,1,SHORT")
これです。
「ロング」「ショート」と書いてあるものを、先ほど作った売買タイミングの「LONG_ORDER」「SHORT_ORDER」に置き換えます。
alertcondition(LONG_ORDER, title = "LONG_ALERT", message = ",HPotter_strategy,BUY,1,LONG")
alertcondition(SHORT_ORDER, title = "SHORT_ALERT", message = ",HPotter_strategy,SELL,1,SHORT")
出来上がったこちらをソースコードに挿入します。
//@version=2
fADX(Len) =>
   up = change(high)
   down = -change(low)
   trur = rma(tr, Len)
   plus = fixnan(100 * rma(up > down and up > 0 ? up : 0, Len) / trur)
   minus = fixnan(100 * rma(down > up and down > 0 ? down : 0, Len) / trur)
   sum = plus + minus
   100 * rma(abs(plus - minus) / (sum == 0 ? 1 : sum), Len)
study(title="Ergodic CSI Backtest")
r = input(32, minval=1)
Length = input(1, minval=1)
BigPointValue = input(1.0, minval=0.00001)
SmthLen = input(5, minval=1)
SellZone = input(0.004, minval=0.00001)
BuyZone = input(0.024, minval=0.001)
reverse = input(false, title="Trade reverse")
hline(BuyZone, color=green, linestyle=line)
hline(SellZone, color=red, linestyle=line)
source = close
K = 100 * (BigPointValue / sqrt(r) / (150 + 5))
xTrueRange = atr(1)
xADX = fADX(Length)
xADXR = (xADX + xADX[1]) * 0.5
nRes = iff(Length + xTrueRange > 0, K * xADXR * xTrueRange / Length,0)
xCSI = iff(close > 0,  nRes / close, 0)
xSMA_CSI = sma(xCSI, SmthLen)
pos = iff(xSMA_CSI > BuyZone, 1,
      iff(xSMA_CSI <= SellZone, -1, nz(pos[1], 0)))
possig = iff(reverse and pos == 1, -1,
         iff(reverse and pos == -1, 1, pos))
LONG = possig == 1
SHORT = possig == -1
POSITION = 0
LONG_ORDER = LONG and POSITION[1] != 1
SHORT_ORDER = SHORT and POSITION[1] != -1
POSITION := LONG_ORDER ? 1 : SHORT_ORDER ? -1 : nz(POSITION[1])
plotshape(LONG_ORDER, style=shape.labelup, color=green,  location=location.bottom, text="L", textcolor=white, title="LONG_ORDER")
plotshape(SHORT_ORDER, style=shape.labeldown, color=red, location=location.top, text="S", textcolor=white, title="SHORT_ORDER")
alertcondition(LONG_ORDER, title = "LONG_ALERT", message = ",HPotter_strategy,BUY,1,LONG")
alertcondition(SHORT_ORDER, title = "SHORT_ALERT", message = ",HPotter_strategy,SELL,1,SHORT")
barcolor(possig == -1 ? red: possig == 1 ? green : blue )
plot(xCSI, color=green, title="Ergodic CSI")
plot(xSMA_CSI, color=red, title="SigLin")
完成です!
お疲れさまでした。
最後にアラートの設定をしてみましょう。
TradingViewの時計マークを押します。
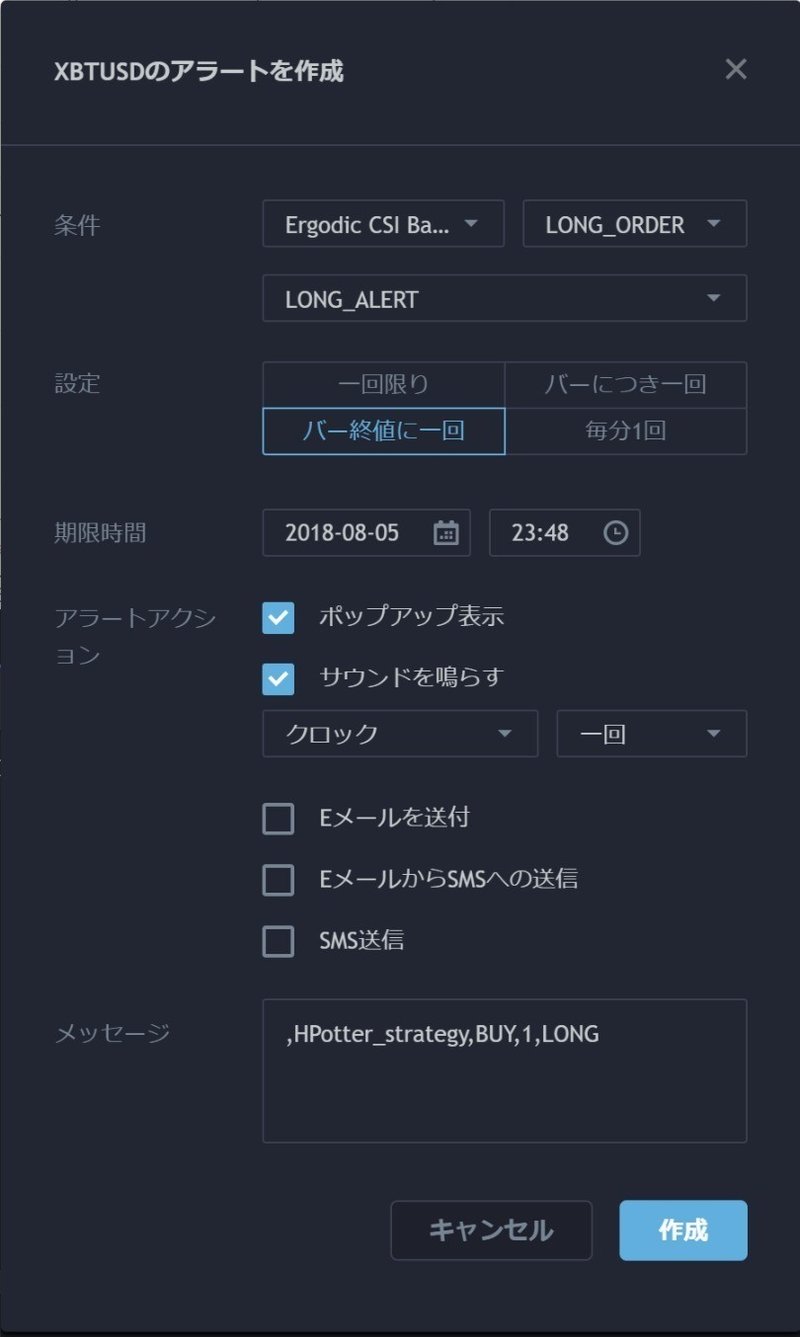
ロングの条件と、
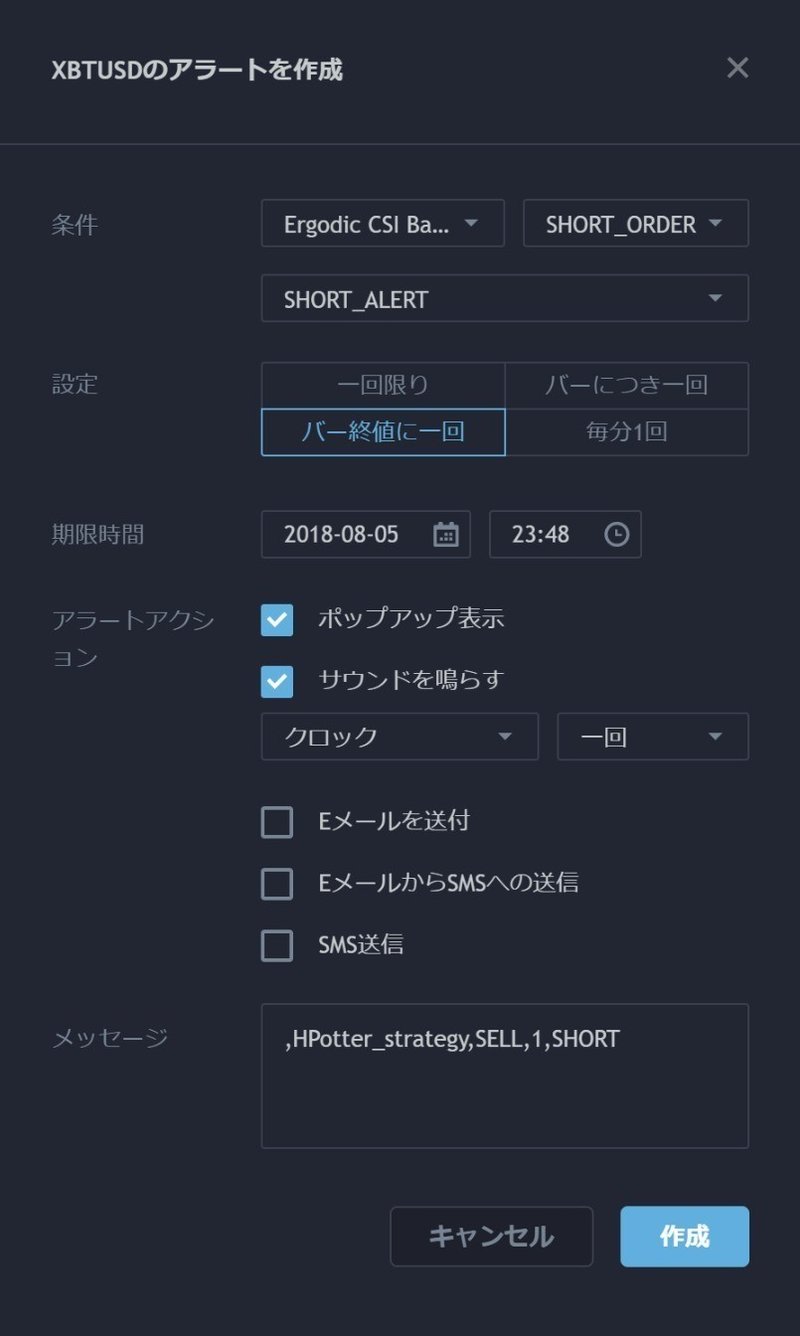
ショートの条件がそれぞれ設定できるようになりました。
※はむすたーユーザーの方はこれでそのまま自動売買をしないようにしてください。ただ自動化しただけの未調整のストラテジーです。
いかがでしょうか。
これでTradingViewにあるストラテジーや色々な人が出しているpineスクリプトは基本的にすべて自動化できます。
ぜひご自身でいろいろ試してみてください。
またはむすたーユーザーの方は良いストラテジーがありましたらぜひコミュニティ内でも共有してくださいね!
はむすたーが気になる方はDiscordのコミュニティも覗いてみてください。
またわからない点があればコミュニティ内でもここのコメント欄でもTwitterでもどこでも構わないので質問していただければと思います。
ProjectBBBでした。
読んでいただいてありがとうございます!