Data set and explanation about drawing coastline on the earth with Tableau (used in the viz "Volcanoes on the earth")

Let me explain about how to draw coastline on the earth and rotate it with tableau.
The sample workbook is downloadable on tableau public.
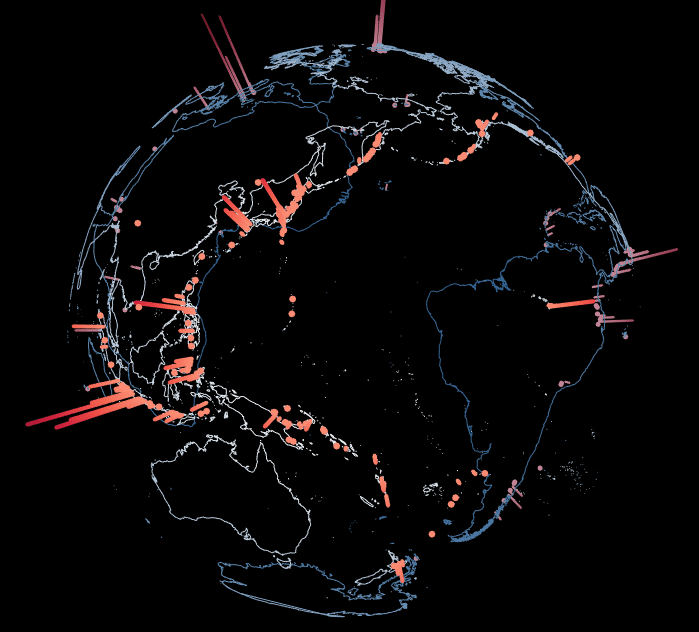
The viz "Volcanoes on the earth" is here (downloadable)
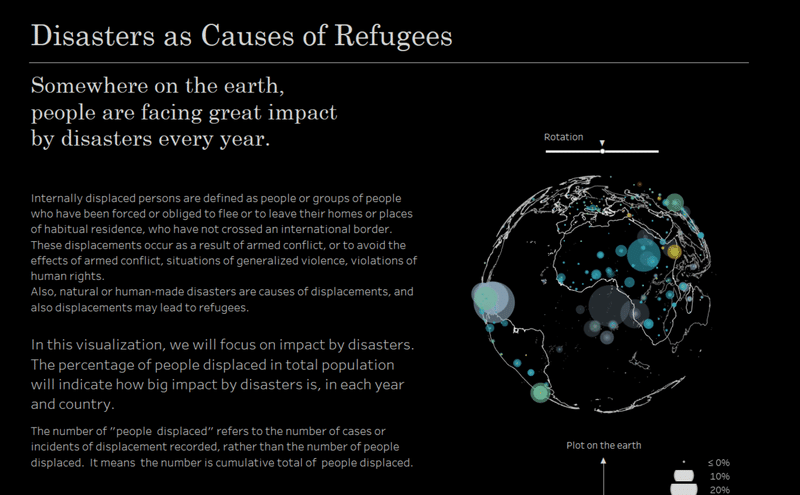
Also, same technique is used in following #vizforsocialgood viz(downloadable)
At first, I'll share data set for coastline.
(This data originally came from following web site.)
https://naturalearthdata.com/downloads/10m-physical-vectors/10m-coastline/
Low resolution (used in viz above)
High resolution
In this data [ID] is ID number for lines.
And, [Path] is sequence number of points in each line.
[Latitude] and [Longitude] mean latitude and longitude of each point of course.
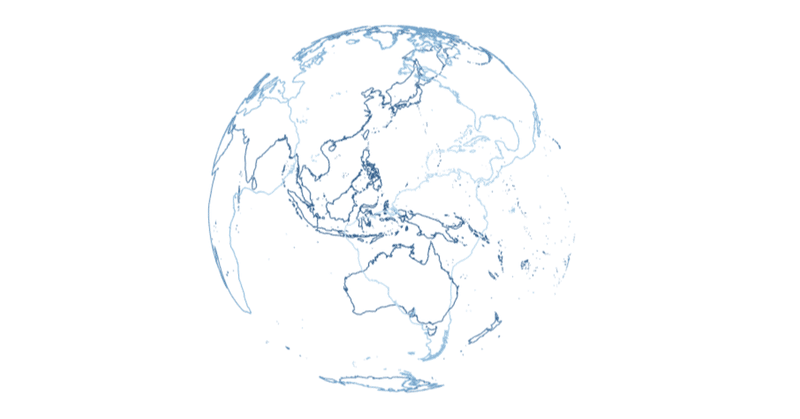
We can draw the coastline map as following.

Next,
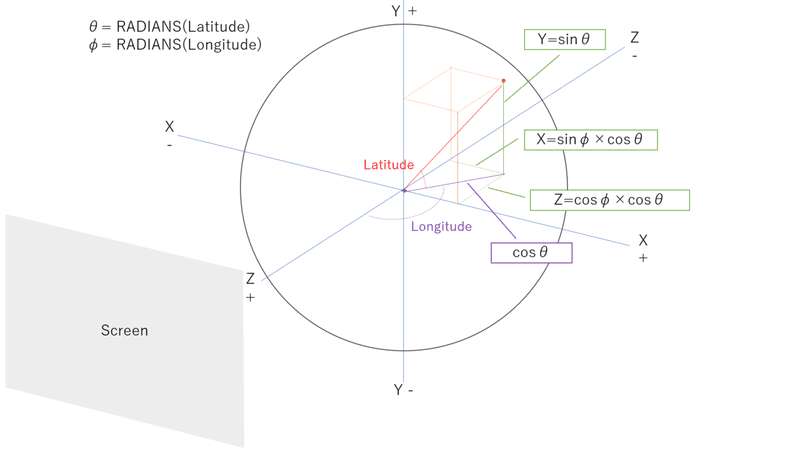
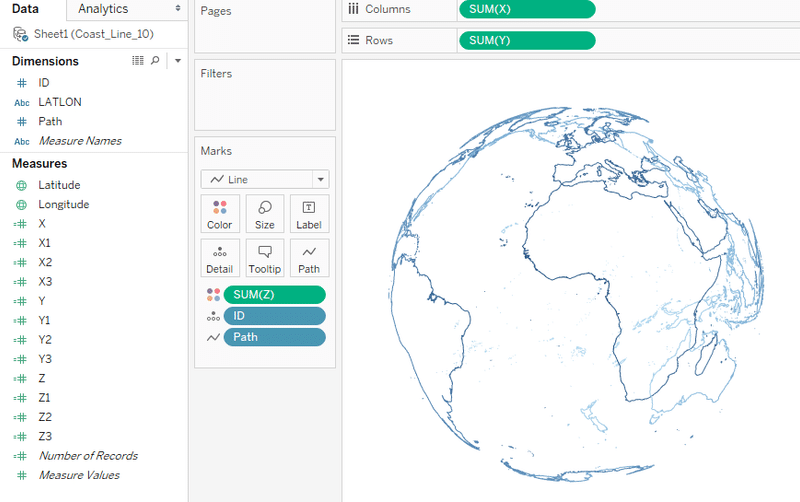
we will calculate X, Y, Z position on the screen to draw on the earth
X = SIN(RADIANS([Longitude]))*COS(RADIANS([Latitude]))
Y = SIN(RADIANS([Latitude]))
Z = COS(RADIANS([Longitude]))*COS(RADIANS([Latitude]))
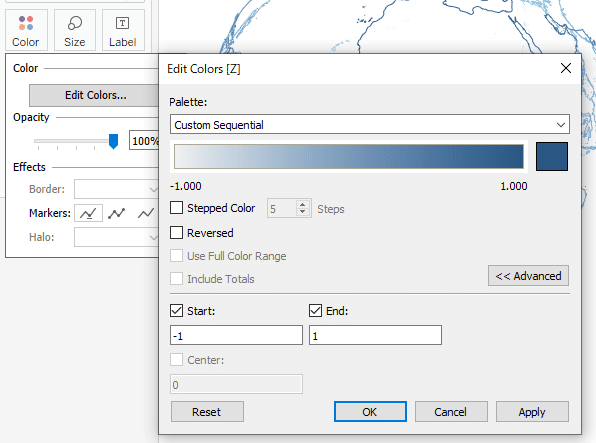
With plotting X, Y and coloring with Z, the following earth will be drawn.
Next, set parameters for rotation.
Parameter [A] : Y axis rotation angle
Parameter [B] : X axis rotation angle
Parameter [C] : Z axis rotation angle
With these parameters, we will calculate new X, Y and Z position step by step.
(I referred this website for rotation calculation.)
http://fnorio.com/0098spherical_trigonometry1/spherical_trigonometry1.html
The matrix calculation is as following.
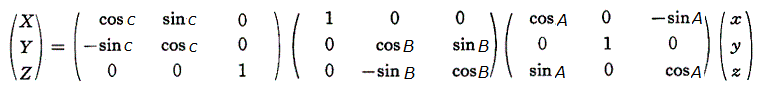
A, B, C are parameters for rotation angle of 3 axis.
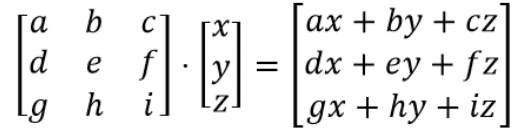
*Matrix calculation (3 x 3) is following calculation.
From right side of matrix calculation,
X , Y ,Z → X1 , Y1 , Z1
then
X1 , Y1 ,Z1 → X2 , Y2 , Z2
then
X2 , Y2 ,Z2 → X3 , Y3 , Z3
Each calculation is as following.
X1 = (cos(RADIANS([A]))*[X]+0*[Y]-sin(RADIANS([A]))*[Z])
Y1 = (0*[X]+1*[Y]+0*[Z])
Z1 = (sin(RADIANS([A]))*[X]+0*[Y]+cos(RADIANS([A]))*[Z])
X2 = (1*[X1]+0*[Y1]+0*[Z1])
Y2 = (0*[X1]+cos(RADIANS([B]))*[Y1]+sin(RADIANS([B]))*[Z1])
Z2 = (0*[X1]-sin(RADIANS([B]))*[Y1]+cos(RADIANS([B]))*[Z1])
X3 = (cos(RADIANS([C]))*[X2]+sin(RADIANS([C]))*[Y2]+0*[Z2])
Y3 = (-sin(RADIANS([C]))*[X2]+cos(RADIANS([C]))*[Y2]+0*[Z2])
Z3 = (0*[X2]+0*[Y2]+1*[Z2])
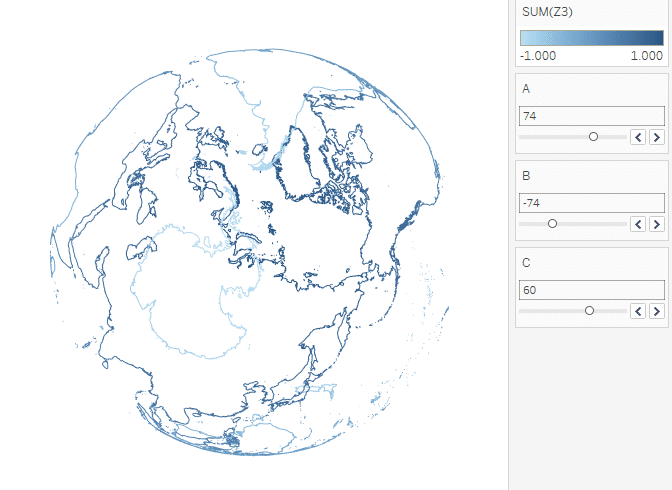
Finally, [X3] , {Y3] , [Z3] are used for drawing.
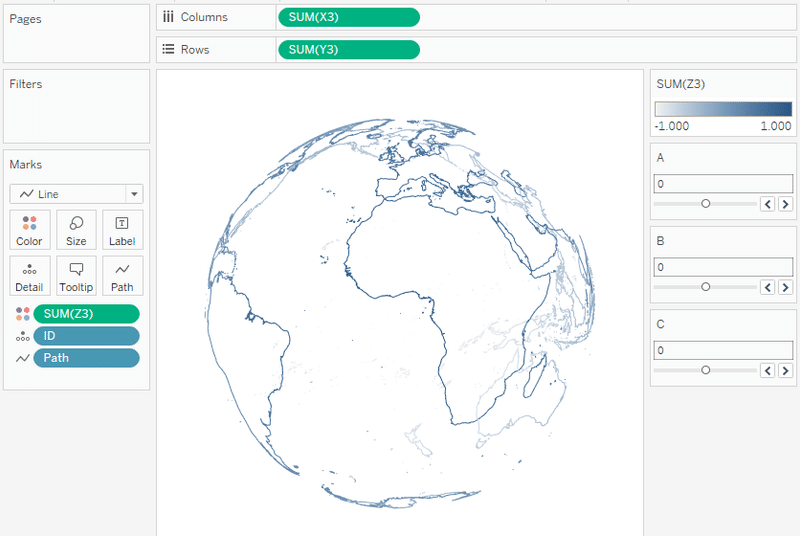
We can rotate the earth with adjusting parameters {A], [B], [C].
The sample workbook is downloadable on tableau public.
https://public.tableau.com/profile/satoshi.ganeko#!/vizhome/CoastlineEarthSample/Earth?publish=yes
Please feel free to use it.
Thank you for reading.
By ritz_Tableau
Tableau Zen Master | Tableau Public Ambassador |
Tableau Certified Professional | Data Saber
Twitter : @ritz_Tableau
この記事が気に入ったらサポートをしてみませんか?