Tableau Data Saber Challenge -5. HandsOn - Intermediate II

Challenge -5. HandsOn - Intermediate IIで学んだ2つの知識と1つの小技を書き留めたいと思います。
I want to jot down two knowledges and one tip I learned in Challenge -5. HandsOn - Intermediate II.
Leaning1:Bins (ビン)
設問3: 1行単位の利益金額1万円ごとに区切ったとき、どの価格帯のオーダーが最も多いでしょうか。なお、区切る金額は見る部門によって違うことがあるようなので5千円ごとに5千~2万円で変更できるようにして下さい。
Solution: Want to Categorize⇒ Utilize "Bins" Function!
ビンとは:ビンとはメジャーを一定区間ごとに区切った入れ物であり、度数分布表の「階級」に相当するもの
What is "Bins"?: the containers to split measures by certain amounts
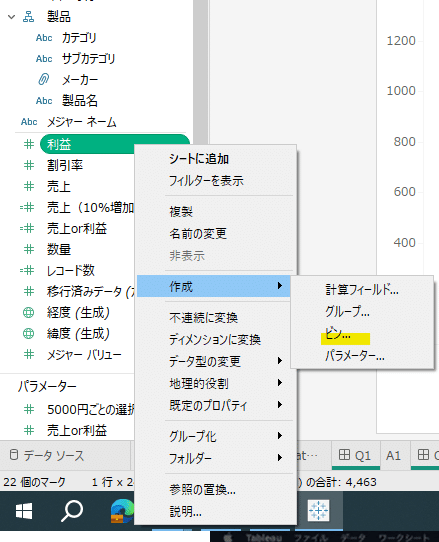
Right click measure> Create> Bins
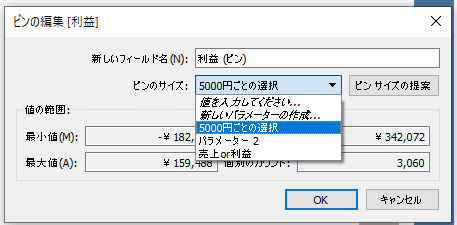
Set up "certain amounts", you can input constant or put parameter which is created in advance

Created parameter to split amount by 5,000 this time
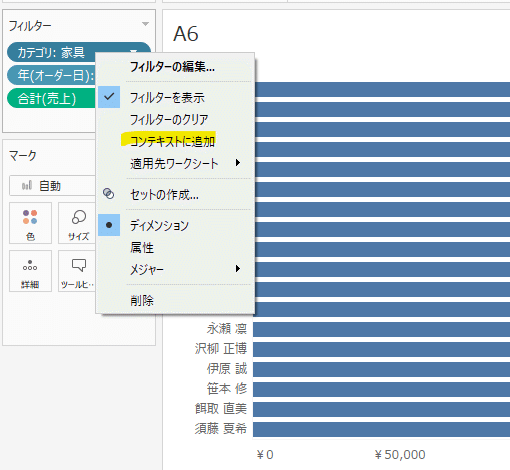
Leaning 2 : How to control the order of filter? (Context Filter ) (フィルターの順序の制御方法 - コンテキストフィルター)
Dimension filter (blue pill) is prioritized than measure filter (Green pill) ディメンションフィルター(青ピル)よりメジャーフィルター(緑ピル)の方が後にフィルターされる

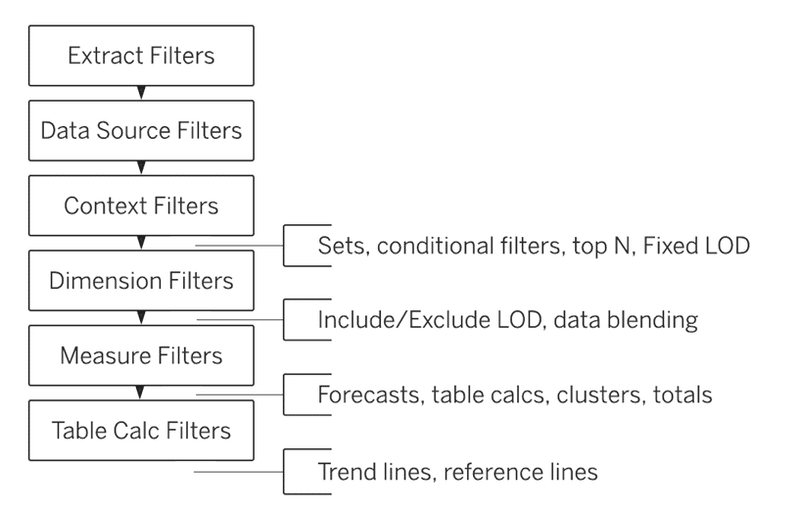
2. "Add to the context" the filter you want to prioritize
優先したいフィルターを”コンテキストに追加”
Tips 1: Exclude "All" from the filter (フィルターから”すべて”を削除)
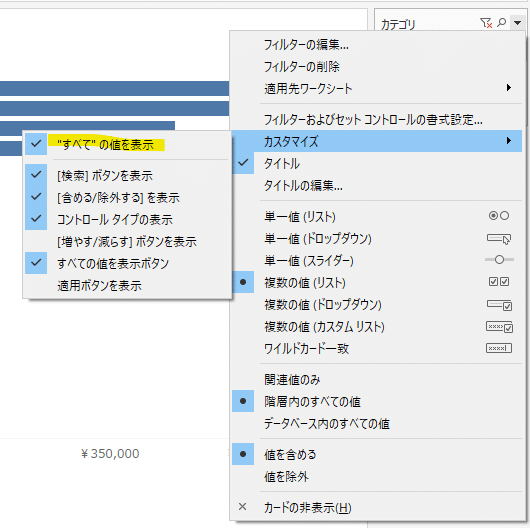
活用例:年度でフィルターして売上の月別推移を示すチャート(列に月、行に売上合計)を作るケース
2020年4月+2021年4月+2023年4月の合計をする必要はないので”すべて”という項目はフィルター内に不要
Usage example: In the case of creating a chart showing the monthly sales trend filtered by fiscal year (with months in columns and total sales in rows)
There is no need to sum up April 2020, April 2021, and April 2023, so the 'All' option is unnecessary in the filter.
この記事が気に入ったらサポートをしてみませんか?