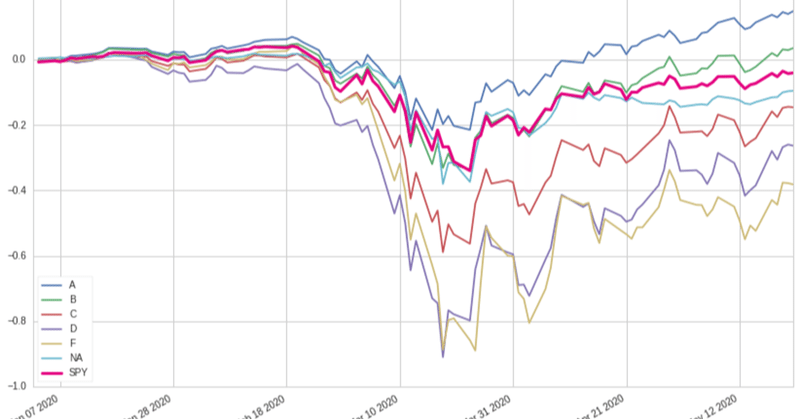
モーニングスターの格付け毎に年初来の株価推移を確認したら,ランクAは+14%だった

Quantopian の MorningStar Fundamental 情報に,financial_health_grade というデータがあります.
デフォルトまでの距離をランク付けし、ユニバースの10%をA、20%をB、40%をC、20%をD、10%をFとします。モーニングスターはこの数値を毎日自社で計算しているものです.
今回は,QTradableStocksUS をユニバースにわたし,5/22(金)現在で格付けを取得し,各格付けに入っている銘柄の値動きの平均値を年初来で描画したいと思います.
note: 下記のコードを試したい方は,https://www.quantopian.com/notebooks で新しいノートブックを作ってコピペするとできるハズです.
ランキング取得
from quantopian.pipeline import Pipeline
from quantopian.research import run_pipeline
from quantopian.pipeline.filters import QTradableStocksUS
from quantopian.pipeline.data import USEquityPricing
from quantopian.pipeline.factors import Returns

from quantopian.pipeline.data.morningstar import Fundamentals

def make_pipeline():

   base_universe = QTradableStocksUS()
   close_price = USEquityPricing.close.latest

   # sector code
   financial_health_grade = Fundamentals.financial_health_grade.latest
   prev_change = Returns(inputs = [USEquityPricing.close], window_length=2)


   return Pipeline(
       columns = {
           'close_price': close_price,
           'financial_health_grade':financial_health_grade,
           'prev_change':prev_change,
       },

       screen=base_universe
   )

pipeline_output = run_pipeline(
   make_pipeline(),
   start_date='2020-05-21',
   end_date='2020-05-22'
)
ランキング確認
lastdate = pipeline_output.index.get_level_values(0)[-1]
df_lastdate = pipeline_output.loc[lastdate]
def get_tickers_by_ranking(df, label):
df_rank = df[df["financial_health_grade"] == label]
tickers = df_rank.index
return tickers
A = get_tickers_by_ranking(df_lastdate, "A")
B = get_tickers_by_ranking(df_lastdate, "B")
C = get_tickers_by_ranking(df_lastdate, "C")
D = get_tickers_by_ranking(df_lastdate, "D")
F = get_tickers_by_ranking(df_lastdate, "F")
NA = get_tickers_by_ranking(df_lastdate, np.nan) # 格付けされていない銘柄もある
len(A), len(B), len(C), len(D), len(F)
各銘柄数は
(326, 656, 889, 218, 25)と出ました.
格付けごとに株価推移
上記で使った pipeline の output を使ってもいいのですが、銘柄によっては この時期に QTradableStocksUS に出たり入ったりしている銘柄もあるので、price を使って株価をとり直します.比較のためにSPYも描画します.
ランキングごとに終値を取得し、前日比の平均を足しあわせて描画します.
from quantopian.research import prices, symbols
start='2020-01-01'
end='2020-05-22'

close_price_A = prices(assets=A,start=start, end=end,)
close_price_B = prices(assets=B,start=start, end=end,)
close_price_C = prices(assets=C,start=start, end=end,)
close_price_D = prices(assets=D,start=start, end=end,)
close_price_F = prices(assets=F,start=start, end=end,)
close_price_NA = prices(assets=NA,start=start, end=end,)
close_price_SPY = prices(assets="SPY",start=start, end=end,)


close_price_A.pct_change().mean(axis=1).cumsum().plot(label="A", legend=True)
close_price_B.pct_change().mean(axis=1).cumsum().plot(label="B", legend=True)
close_price_C.pct_change().mean(axis=1).cumsum().plot(label="C", legend=True)
close_price_D.pct_change().mean(axis=1).cumsum().plot(label="D", legend=True)
close_price_F.pct_change().mean(axis=1).cumsum().plot(label="F", legend=True)
close_price_NA.pct_change().mean(axis=1).cumsum().plot(label="NA", legend=True)
close_price_SPY.pct_change().cumsum().plot(label="SPY", legend=True, linewidth=3, color='#e4007f')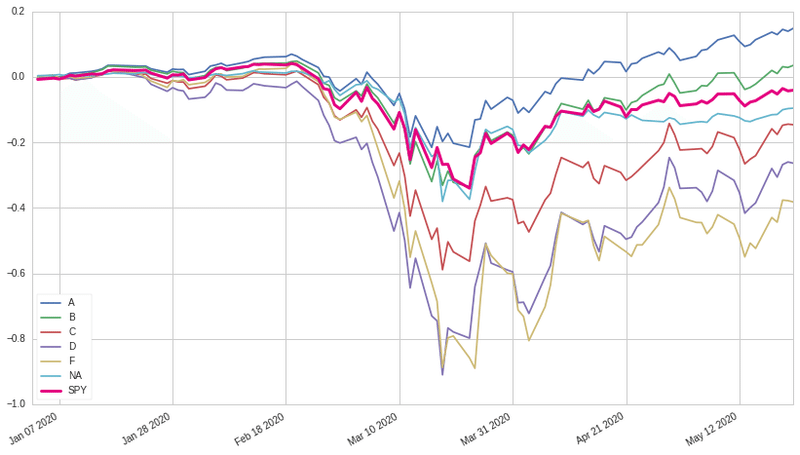
こうするとランクAの銘柄は既に年始よりしっかり戻しています.どのような銘柄が入っているかは,
A.map(lambda x: x.asset_name)で確認出来ます.
この記事が気に入ったらサポートをしてみませんか?