【無料配布】フィボナッチを自動で引いてくれるインジ

まず初めに…
初めまして!Takkyです。
以下ツイッターアカウントですが、フォローしてくださっている皆様いつもありがとうございます!(定期的にインジとかを配っていきたいと思うのでこれを機にFollwしてもらえると嬉しいです!)
今回ご紹介するのは、皆さんもよくおなじみのフィボナッチにちなんだインジケータ第二弾になりますw
(しつこいわ!とか思わんでくださいw
インジ概要
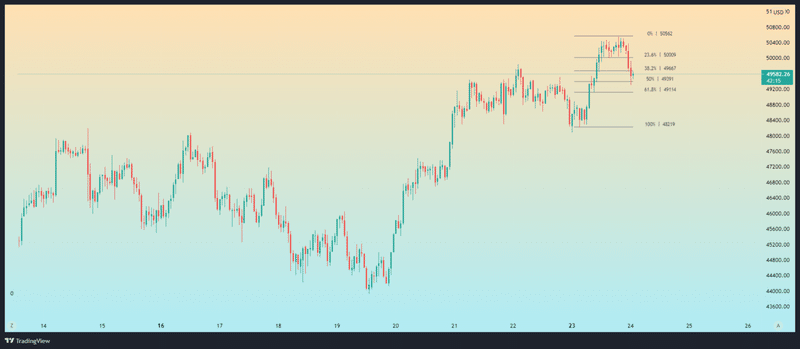
チャート上に表示されている線には設定した期間内の高安を取得してそれぞれ指定期間内で勝手にフィボナッチの線を引いてくれるインジケータになります。(フィボナッチの使い方などはご自身でお調べください~)
パラメータ概要
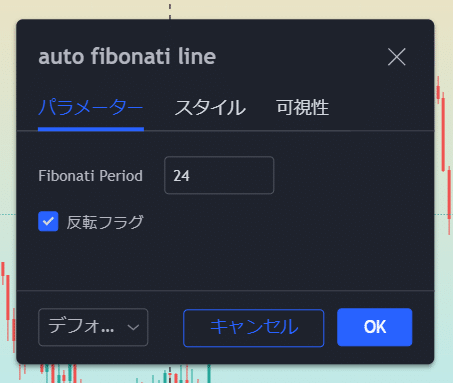
パラーメータは以前のフィボナッチのインジケータと同様でシンプルです。
上記の「fibonati period」の期間で設定された中で高値安値を算出し、その高安の範囲内のフィボナッチのそれぞれの割合を計算してくれます。
反転フラグはデフォルトはチェックが入っていない状態ですが、それぞれの意味合いは以下になります。
反転フラグチェックなし:高値を起点としてフィボナッチの計算を行う
反転フラグチェックあり:安値を起点としてフィボナッチの計算を行う
特にそれ以外の説明はすることないので、以下はコードになります~。
もしよければ使ってあげてくださいませ。
ではでは~。
// This source code is subject to the terms of the Mozilla Public License 2.0 at https://mozilla.org/MPL/2.0/
// © takky931028

//@version=4
study("auto fibonati line" , overlay = true )

f_period = input(24 , "fibonati period")
ll_offset = timenow + round(change(time)*10)
hanten_flg = input(false , "反転フラグ", type=input.bool)

pivot_0     = highest(high,f_period)
pivot_23_6  = highest(high,f_period) - (highest(high,f_period) - lowest(low,f_period)) * 0.236
pivot_38_2  = highest(high,f_period) - (highest(high,f_period) - lowest(low,f_period)) * 0.382
pivot_50    = (highest(high,f_period) + lowest(low,f_period)) / 2
pivot_61_8  = highest(high,f_period) - (highest(high,f_period) - lowest(low,f_period)) * 0.618
pivot_100   = lowest(low,f_period)

if hanten_flg
   pivot_100   := highest(high,f_period)
   pivot_61_8  := lowest(low,f_period) + (highest(high,f_period) - lowest(low,f_period)) * 0.618
   pivot_50    := (highest(high,f_period) + lowest(low,f_period)) / 2
   pivot_38_2  := lowest(low,f_period) + (highest(high,f_period) - lowest(low,f_period)) * 0.382
   pivot_23_6  := lowest(low,f_period) + (highest(high,f_period) - lowest(low,f_period)) * 0.236
   pivot_0     := lowest(low,f_period)

low1 = line.new(bar_index, pivot_0, bar_index[f_period], pivot_0,color=color.gray)
line.delete(low1[1])
l_low1 = label.new(x=ll_offset, y=pivot_0, xloc=xloc.bar_time, yloc=yloc.price, text = "0% ║ " + tostring(pivot_0 , "00.00") , style=label.style_none , size = size.small)
label.delete(l_low1[1])

low2 = line.new(bar_index, pivot_23_6, bar_index[f_period], pivot_23_6,color=color.gray)
line.delete(low2[1])
l_low2 = label.new(x=ll_offset, y=pivot_23_6, xloc=xloc.bar_time, yloc=yloc.price, text = "23.6% ║ " + tostring(pivot_23_6 , "00.00") , style=label.style_none , size = size.small)
label.delete(l_low2[1])

low3 = line.new(bar_index, pivot_38_2, bar_index[f_period], pivot_38_2,color=color.gray)
line.delete(low3[1])
l_low3 = label.new(x=ll_offset, y=pivot_38_2, xloc=xloc.bar_time, yloc=yloc.price, text = "38.2% ║ " + tostring(pivot_38_2 , "00.00") , style=label.style_none , size = size.small)
label.delete(l_low3[1])

low4 = line.new(bar_index, pivot_50, bar_index[f_period], pivot_50,color=color.gray)
line.delete(low4[1])
l_low4 = label.new(x=ll_offset, y=pivot_50, xloc=xloc.bar_time, yloc=yloc.price, text = "50% ║ " + tostring(pivot_50 , "00.00") , style=label.style_none , size = size.small)
label.delete(l_low4[1])

low5 = line.new(bar_index, pivot_61_8, bar_index[f_period], pivot_61_8,color=color.gray)
line.delete(low5[1])
l_low5 = label.new(x=ll_offset, y=pivot_61_8, xloc=xloc.bar_time, yloc=yloc.price, text = "61.8% ║ " + tostring(pivot_61_8 , "00.00") , style=label.style_none , size = size.small)
label.delete(l_low5[1])

low6 = line.new(bar_index, pivot_100, bar_index[f_period], pivot_100,color=color.gray)
line.delete(low6[1])
l_low6 = label.new(x=ll_offset, y=pivot_100, xloc=xloc.bar_time, yloc=yloc.price, text = "100% ║ " + tostring(pivot_100 , "00.00") , style=label.style_none , size = size.small)
label.delete(l_low6[1])この記事が気に入ったらサポートをしてみませんか?