note.comで使えるチャート/グラフ

note.comではmarkdownとmermaidを組み合わせて、チャート/グラフを表示することができます。情報科学分野に特化したものが多いのですが、アイデア次第で非エンジニアのライターにとっても強力な武器となる可能性があります。
使用上の注意点とともに使い方の提案をご説明いたします。
チャート/グラフの効果的な使い方
ガントチャート
```mermaid
gantt
    title A Gantt Diagram
    dateFormat  YYYY-MM-DD
    section Section
    A task           :a1, 2014-01-01, 30d
    Another task     :after a1  , 20d
    section Another
    Task in sec      :2014-01-12  , 12d
    another task      : 24d
```
スケジュール管理のためのチャートです。
プロジェクトやチームの進捗について予実(予定と実績)を広く伝えるために有用です。note.comを進捗報告に利用する場合、下記のような手順で利用すると効率的です。
記事を作成し、ガントチャートを記述。
記事テンプレートと保存
都度の報告を記事テンプレートから作成
進捗の数値を入力する
タイムライン
```mermaid
timeline
    title History of Social Media Platform
    2002 : LinkedIn
    2004 : Facebook
         : Google
    2005 : Youtube
    2006 : Twitter
```
プロジェクトの経過、団体の沿革、個人の経歴などを時系列で説明するのに有効です。経年によって要追加事項が発生した場合も、過去の記事をからコピーして使えます。
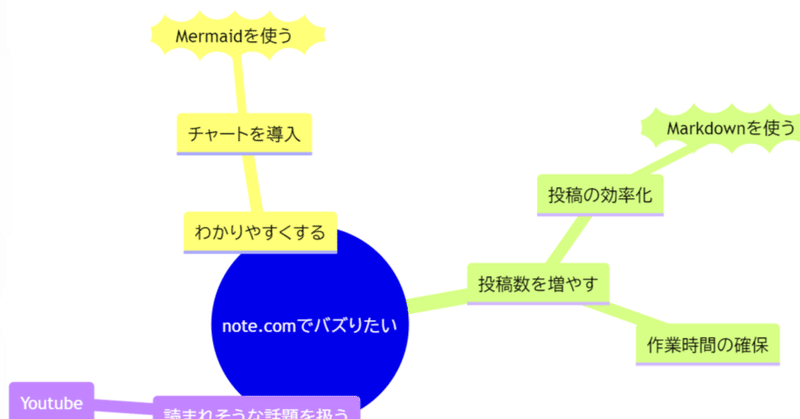
マインドマップ
```mermaid
mindmap
  root((mindmap))
    Origins
      Long history
      ::icon(fa fa-book)
      Popularisation
        British popular psychology author Tony Buzan
    Research
      On effectivness<br/>and features
      On Automatic creation
        Uses
            Creative techniques
            Strategic planning
            Argument mapping
    Tools
      Pen and paper
      Mermaid
```
アイデアや思考を整理する際によく使います。これも過去の記事からコピーして、変化を記述していくことができます。
表示位置を強制的に変更できない代わりに、書き換えが非常に用意です。ぜひ活用していただきたいです。
GITグラフ
GITとは、ソフトウェア開発におけるバージョン管理ツールです。GITグラフは、複数の作業の結合を図示するためのグラフです。
これを利用して、並行する作業の合流するタイミングや、作業承認のタイミングなどを表現することができます。
```mermaid
gitGraph
    commit
    commit
    branch develop
    checkout develop
    commit
    commit
    checkout main
    merge develop
    commit
    commit

```
注意点
note.comで現在(2024/2)採用されているmermaidはver10.6です。
テーマ編集は使えない
---
title: Hello Title
config:
  theme: base
  themeVariables:
    primaryColor: "#00ff00"
---
flowchart
	Hello --> World
公式には上記のように設定ブロックを利用して外観を変更できるのですが、note.comではこれは動作しないようです。
小さくなりがち
note.comは表示幅が狭めです。かつ「テーマ編集が使えない」ため、横幅を大きくとるような図では小さくなってしまいます。簡略化したり図の情報量を減らすなど、非技術的な対応が必要になります。
プレビューは数秒待ってから
プレビュー画面の更新による自動反映で表示を確認しようとすると、どうしても遅れが発生します。その場合、文書途中で更新され、構文やmermaidブロックが不完全な状態で「Syntacs Error」になる可能性があります。
その場合は、焦らずに気持ち待ってから更新するか、下書き保存をするのが確実です。
ZenUMLとBlockは動作対象外
ZenUMLという別のDSLを利用してシーケンス図を表示できるそうです。
ZenUMLについて、まだ導入事例が少なくmermaidとの差別化もよくわかりませんが、現時点でmermaidのsequenceDiagramを利用するほうが無難のようです。
Blockについてはver10.8.0からのサポートのため、まだnote.comのほうが追い付いていないということのようです。
ベータ仕様
C4 / XY chart / Block はベータ仕様です。表示はできていますが、今後変更になるため、1年後に過去に書いた記事がエラーで表示されないことになります。
というのは、指示子が確実に変更になるからです。指示子の後方修飾(suffix)に "-beta"とついているので、今後これが確実に外れるはずです。
ほかにもこんなに使えるチャート
ここまでで表示・説明できていなかった図について、[Mermaid公式ページ](https://mermaid.js.org/) 記載のサンプルが、note.comでどのように表示されるか検証しています。参考にしてください。
今回は公式からコピーしたコードでのみ紹介しますが、今後は使えそうなグラフひとつひとつについて具体的な使用方法を提示できるようにしたいと思っています。
フローチャート
```mermaid
flowchart TD
    A[Christmas] -->|Get money| B(Go shopping)
    B --> C{Let me think}
    C -->|One| D[Laptop]
    C -->|Two| E[iPhone]
    C -->|Three| F[fa:fa-car Car]
```
シーケンス図
```mermaid
sequenceDiagram
    Alice->>+John: Hello John, how are you?
    Alice->>+John: John, can you hear me?
    John-->>-Alice: Hi Alice, I can hear you!
    John-->>-Alice: I feel great!
```
クラス図
```mermaid
classDiagram
    Animal <|-- Duck
    Animal <|-- Fish
    Animal <|-- Zebra
    Animal : +int age
    Animal : +String gender
    Animal: +isMammal()
    Animal: +mate()
    class Duck{
      +String beakColor
      +swim()
      +quack()
    }
    class Fish{
      -int sizeInFeet
      -canEat()
    }
    class Zebra{
      +bool is_wild
      +run()
    }
```
ステート図
```mermaid
stateDiagram-v2
    [*] --> Still
    Still --> [*]
    Still --> Moving
    Moving --> Still
    Moving --> Crash
    Crash --> [*]
```
ER図
```mermaid
erDiagram
    CUSTOMER }|..|{ DELIVERY-ADDRESS : has
    CUSTOMER ||--o{ ORDER : places
    CUSTOMER ||--o{ INVOICE : "liable for"
    DELIVERY-ADDRESS ||--o{ ORDER : receives
    INVOICE ||--|{ ORDER : covers
    ORDER ||--|{ ORDER-ITEM : includes
    PRODUCT-CATEGORY ||--|{ PRODUCT : contains
    PRODUCT ||--o{ ORDER-ITEM : "ordered in"
```
ユーザジャーニー
```mermaid
journey
    title My working day
    section Go to work
      Make tea: 5: Me
      Go upstairs: 3: Me
      Do work: 1: Me, Cat
    section Go home
      Go downstairs: 5: Me
      Sit down: 3: Me
```
パイチャート
```mermaid
pie title Pets adopted by volunteers
    "Dogs" : 386
    "Cats" : 85
    "Rats" : 15
```
クアドラントチャート
```mermaid
quadrantChart
    title Reach and engagement of campaigns
    x-axis Low Reach --> High Reach
    y-axis Low Engagement --> High Engagement
    quadrant-1 We should expand
    quadrant-2 Need to promote
    quadrant-3 Re-evaluate
    quadrant-4 May be improved
    Campaign A: [0.3, 0.6]
    Campaign B: [0.45, 0.23]
    Campaign C: [0.57, 0.69]
    Campaign D: [0.78, 0.34]
    Campaign E: [0.40, 0.34]
    Campaign F: [0.35, 0.78]
```
要求図
```mermaid
requirementDiagram

    requirement test_req {
    id: 1
    text: the test text.
    risk: high
    verifymethod: test
    }

    element test_entity {
    type: simulation
    }

    test_entity - satisfies -> test_req
```
C4
```mermaid
    C4Context
      title System Context diagram for Internet Banking System
      Enterprise_Boundary(b0, "BankBoundary0") {
        Person(customerA, "Banking Customer A", "A customer of the bank, with personal bank accounts.")
        Person(customerB, "Banking Customer B")
        Person_Ext(customerC, "Banking Customer C", "desc")

        Person(customerD, "Banking Customer D", "A customer of the bank, <br/> with personal bank accounts.")

        System(SystemAA, "Internet Banking System", "Allows customers to view information about their bank accounts, and make payments.")

        Enterprise_Boundary(b1, "BankBoundary") {

          SystemDb_Ext(SystemE, "Mainframe Banking System", "Stores all of the core banking information about customers, accounts, transactions, etc.")

          System_Boundary(b2, "BankBoundary2") {
            System(SystemA, "Banking System A")
            System(SystemB, "Banking System B", "A system of the bank, with personal bank accounts. next line.")
          }

          System_Ext(SystemC, "E-mail system", "The internal Microsoft Exchange e-mail system.")
          SystemDb(SystemD, "Banking System D Database", "A system of the bank, with personal bank accounts.")

          Boundary(b3, "BankBoundary3", "boundary") {
            SystemQueue(SystemF, "Banking System F Queue", "A system of the bank.")
            SystemQueue_Ext(SystemG, "Banking System G Queue", "A system of the bank, with personal bank accounts.")
          }
        }
      }

      BiRel(customerA, SystemAA, "Uses")
      BiRel(SystemAA, SystemE, "Uses")
      Rel(SystemAA, SystemC, "Sends e-mails", "SMTP")
      Rel(SystemC, customerA, "Sends e-mails to")

      UpdateElementStyle(customerA, $fontColor="red", $bgColor="grey", $borderColor="red")
      UpdateRelStyle(customerA, SystemAA, $textColor="blue", $lineColor="blue", $offsetX="5")
      UpdateRelStyle(SystemAA, SystemE, $textColor="blue", $lineColor="blue", $offsetY="-10")
      UpdateRelStyle(SystemAA, SystemC, $textColor="blue", $lineColor="blue", $offsetY="-40", $offsetX="-50")
      UpdateRelStyle(SystemC, customerA, $textColor="red", $lineColor="red", $offsetX="-50", $offsetY="20")

      UpdateLayoutConfig($c4ShapeInRow="3", $c4BoundaryInRow="1")
```
サンキー
```mermaid
sankey-beta

Agricultural 'waste',Bio-conversion,124.729
Bio-conversion,Liquid,0.597
Bio-conversion,Losses,26.862
Bio-conversion,Solid,280.322
Bio-conversion,Gas,81.144
Biofuel imports,Liquid,35
Biomass imports,Solid,35
Coal imports,Coal,11.606
Coal reserves,Coal,63.965
Coal,Solid,75.571
District heating,Industry,10.639
District heating,Heating and cooling - commercial,22.505
District heating,Heating and cooling - homes,46.184
Electricity grid,Over generation / exports,104.453
Electricity grid,Heating and cooling - homes,113.726
Electricity grid,H2 conversion,27.14
Electricity grid,Industry,342.165
Electricity grid,Road transport,37.797
Electricity grid,Agriculture,4.412
Electricity grid,Heating and cooling - commercial,40.858
Electricity grid,Losses,56.691
Electricity grid,Rail transport,7.863
Electricity grid,Lighting & appliances - commercial,90.008
Electricity grid,Lighting & appliances - homes,93.494
Gas imports,Ngas,40.719
Gas reserves,Ngas,82.233
Gas,Heating and cooling - commercial,0.129
Gas,Losses,1.401
Gas,Thermal generation,151.891
Gas,Agriculture,2.096
Gas,Industry,48.58
Geothermal,Electricity grid,7.013
H2 conversion,H2,20.897
H2 conversion,Losses,6.242
H2,Road transport,20.897
Hydro,Electricity grid,6.995
Liquid,Industry,121.066
Liquid,International shipping,128.69
Liquid,Road transport,135.835
Liquid,Domestic aviation,14.458
Liquid,International aviation,206.267
Liquid,Agriculture,3.64
Liquid,National navigation,33.218
Liquid,Rail transport,4.413
Marine algae,Bio-conversion,4.375
Ngas,Gas,122.952
Nuclear,Thermal generation,839.978
Oil imports,Oil,504.287
Oil reserves,Oil,107.703
Oil,Liquid,611.99
Other waste,Solid,56.587
Other waste,Bio-conversion,77.81
Pumped heat,Heating and cooling - homes,193.026
Pumped heat,Heating and cooling - commercial,70.672
Solar PV,Electricity grid,59.901
Solar Thermal,Heating and cooling - homes,19.263
Solar,Solar Thermal,19.263
Solar,Solar PV,59.901
Solid,Agriculture,0.882
Solid,Thermal generation,400.12
Solid,Industry,46.477
Thermal generation,Electricity grid,525.531
Thermal generation,Losses,787.129
Thermal generation,District heating,79.329
Tidal,Electricity grid,9.452
UK land based bioenergy,Bio-conversion,182.01
Wave,Electricity grid,19.013
Wind,Electricity grid,289.366
```
XYチャート
```mermaid
xychart-beta
    title "Sales Revenue"
    x-axis [jan, feb, mar, apr, may, jun, jul, aug, sep, oct, nov, dec]
    y-axis "Revenue (in $)" 4000 --> 11000
    bar [5000, 6000, 7500, 8200, 9500, 10500, 11000, 10200, 9200, 8500, 7000, 6000]
    line [5000, 6000, 7500, 8200, 9500, 10500, 11000, 10200, 9200, 8500, 7000, 6000]
```この記事が気に入ったらサポートをしてみませんか?