5chからデータを取得するshinyアプリ【R/rvest】

Rを使って5chスレッドからデータを取得・保存します。
RSeleniumなどの仮想ブラウザを使わなくてもできるのでとても簡単。
5chの分析やログの保管に良いかもしれません。
▼スレッドの取得
rm(list = ls())
gc()
gc()
library(pacman)
pacman::p_load("tidyverse",
"stringi",
"rvest"
)
# urlを設定
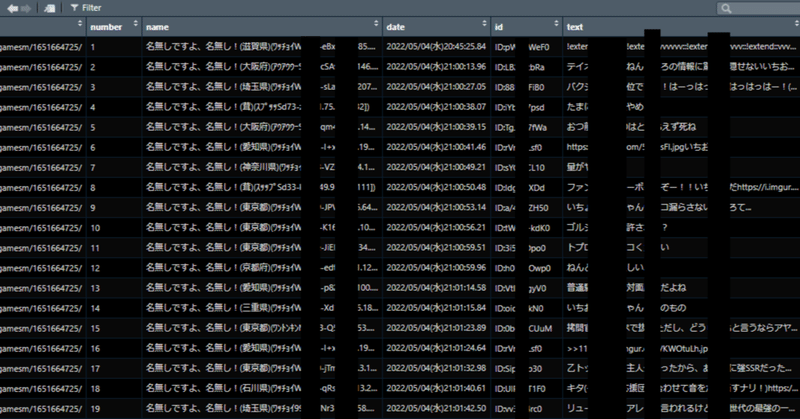
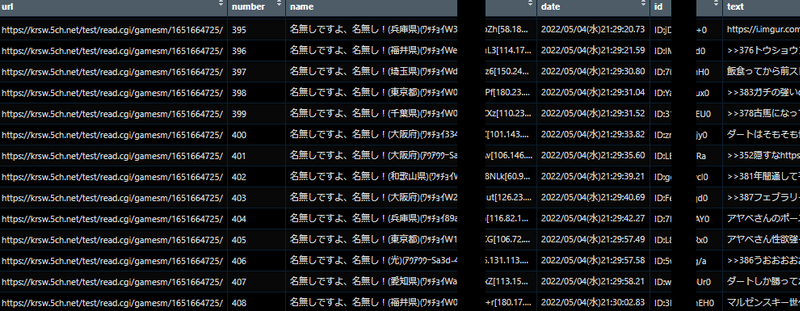
url <- "https://krsw.5ch.net/test/read.cgi/gamesm/1651664725/"試しにウマ娘のスレッドを取得してみます。
page <- read_html(url)
Sys.sleep(1) # wait

page %>%
  html_nodes("[class='title']") %>%
  html_text() %>%
  str_replace_all("\n| ", "") -> title

page %>%
  html_nodes("[class='number']") %>%
  html_text() %>%
  str_replace_all("\n| ", "") -> number

page %>%
  html_nodes("[class='name']") %>%
  html_text() %>%
  str_replace_all("\n| ", "") -> name

page %>%
  html_nodes("[class='date']") %>%
  html_text() %>%
  str_replace_all("\n| ", "") -> date

page %>%
  html_nodes("[class='uid']") %>%
  html_text() %>%
  str_replace_all("\n| ", "") -> uid

page %>%
  html_nodes("[class='escaped']") %>%
  html_text() %>%
  str_replace_all("\n| ", "") -> escaped

tibble(title = title,
       url = url,
       number = number,
       name = name,
       date = date,
       id = uid,
       text = escaped
) -> dat
スレッドの各要素取得は、chromeの検証で確認できるclass名を指定してやります。
> str_detect(dat$text, pattern="ネイチャ") %>% sum() # ネイチャに言及する書き込みの数
[1] 9
> str_detect(dat$text, pattern="スズカ") %>% sum() # ネイチャに言及する書き込みの数
[1] 10
データ化すればどのキャラや人物がどれくらい話題にされているか?
をカウントするのも簡単です。
▼データの保存
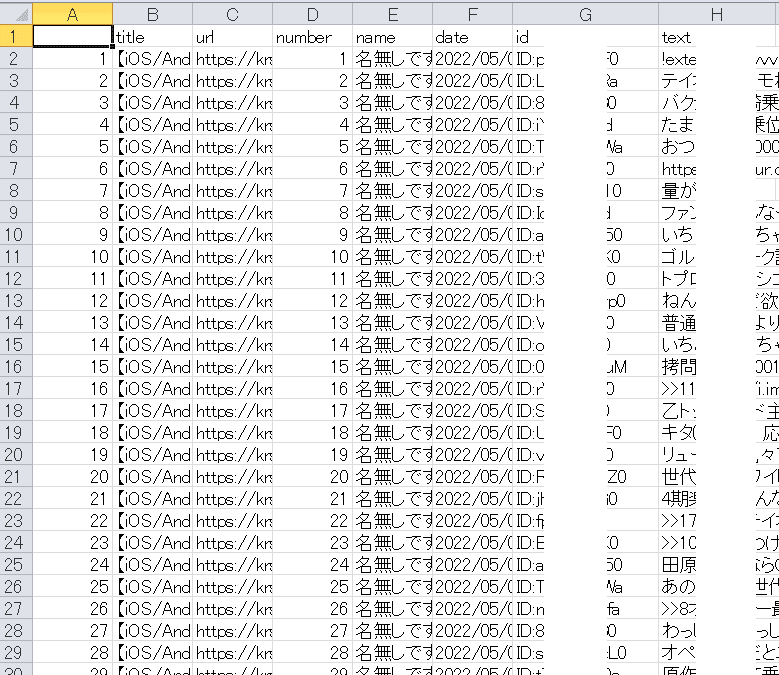
html形式で保存するのも良いですが、csvファイルの方が検索や分析が容易です。
csv形式でデータを保存します。
write.csv(dat,
  paste0(
    str_replace_all( # windowsで使えない文字があるので置換する
      string = title,
      pattern = "/",
      replacement = "_"
    ),
    ".csv"
  ),
  fileEncoding = "CP932"
)
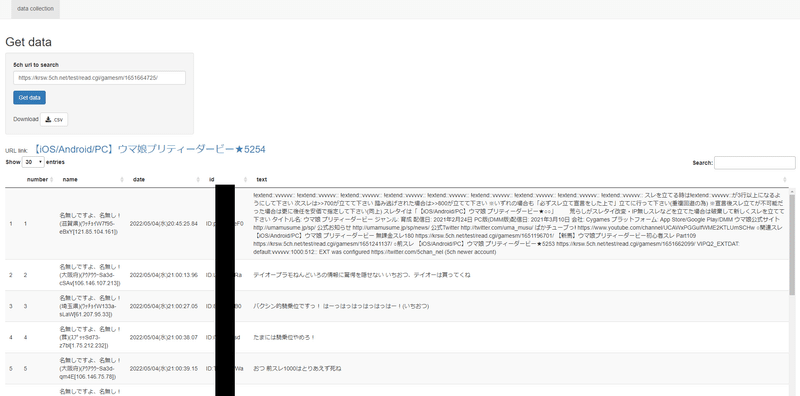
▼アプリ化
rvestしか使わないのでshinyでアプリ化するのも簡単。
rm(list = ls())
gc()
gc()
library("shiny")
library("shinythemes")
library("shinybusy")
library("DT")
library("tidyverse")
library("rvest")
library("lubridate")
library("stringi")

# scrape function
scrape_5ch <- function(set_url) {
  tryCatch({
    page <- read_html(set_url)
    Sys.sleep(1) # wait
    page %>%
      html_nodes("[class='title']") %>%
      html_text() %>%
      str_replace_all("\n| ", "") -> title

    page %>%
      html_nodes("[class='number']") %>%
      html_text() %>%
      str_replace_all("\n| ", "") -> number

    page %>%
      html_nodes("[class='name']") %>%
      html_text() %>%
      str_replace_all("\n| ", "") -> name

    page %>%
      html_nodes("[class='date']") %>%
      html_text() %>%
      str_replace_all("\n| ", "") -> date

    page %>%
      html_nodes("[class='uid']") %>%
      html_text() %>%
      str_replace_all("\n| ", "") -> uid

    page %>%
      html_nodes("[class='escaped']") %>%
      html_text() -> escaped

    tibble(
      title = title,
      url = set_url,
      number = number,
      name = name,
      date = date,
      id = uid,
      text = escaped
    ) -> dat
    return(dat)
  }, error=function(e) NULL)
}


# Define UI for application that draws a histogram
ui <- navbarPage(
  windowTitle = "5ch to csv data",

  # Application title
  br(),
  tabPanel(
    "data collection",
    h2("Get data"),
    # Sidebar
    sidebarLayout(

      sidebarPanel(
        width = 3,
        textInput("ch_url",
                  label = "5ch url to search",
                  value = "https://"
        ),
        actionButton("get_data", "Get data", class = "btn-primary"),
        br(), br(),
        "Download",
        downloadButton("download_data", ".csv")
      ),

      # Show results
      mainPanel(
        width = 10,
        uiOutput("page_url"),
        DT::dataTableOutput("data_table")
      )
    )
  )#,
#  tabPanel(
#    "tab 2",
#    h2("tab2 title"),
#    # Sidebar
#    sidebarLayout(
#      sidebarPanel(
#        width = 0
#      ),
      # main panel
#      mainPanel(
#        width = 12,
#        h4("under_cons"),
#      )
#    )
#  )
)

# Define server logic required to draw a histogram
server <- function(input, output, session) {
  # circle data collection
  xd_data <- eventReactive(
    input$get_data,
    {
      show_modal_spinner()
      x <- scrape_5ch(input$ch_url)
      remove_modal_spinner()
      x
    }
  )

  # url output
  url_text <- reactive({
    req(xd_data())
    url <- a(xd_data()$title[1],
             href= xd_data()$url[1],
             style = "font-size: 24px; color: steelblue;")
  })
  output$page_url <- renderUI({
    tagList("URL link:", url_text())
  })

  # circle_data cleansing
  data_table <- reactive({
    req(xd_data())
    xd <- xd_data()
  })

  # output
  output$data_table <- DT::renderDataTable(
    data_table() %>%
      select(-c(url, title)),
    escape = FALSE,
    options = list(
      lengthMenu = c(10, 30, 100),
      autoWidth = TRUE,
      pageLength = 30,
      scrollY = "800px",
      scrollX = TRUE,
      scrollCollapse = TRUE
    )
  )

  # download button server logic
  output$download_data <- downloadHandler(
    filename = function() {
      paste0(Sys.Date(), "_", ".csv", sep = "")
    },
    content = function(file) {
      write.csv(data_table(),
                file,
                fileEncoding = "CP932"
      )
    }
  )

  # end server logic

}

# Run the application
shinyApp(ui = ui, server = server)
万が一サポート、感想、コメント、分析等のご相談などございましたらお気軽に。