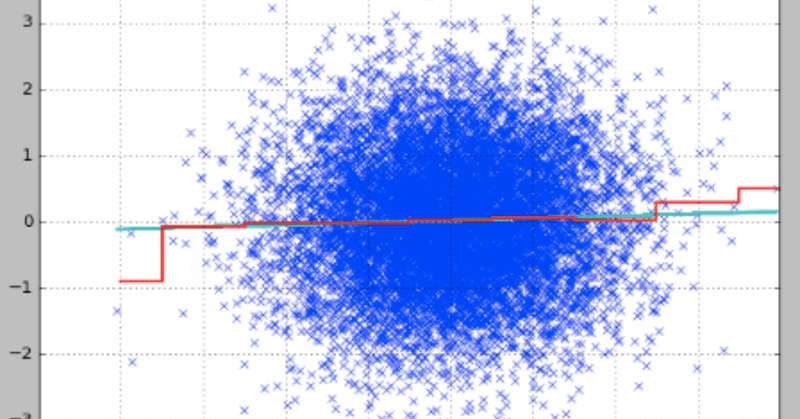
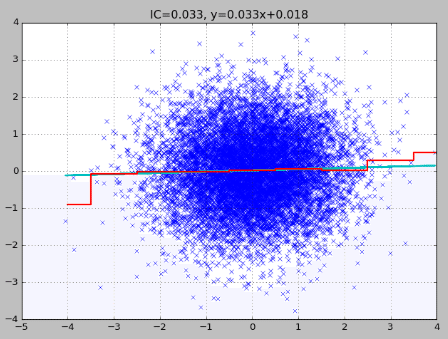
Python で投資指標とリターンの散布図を描く

numpy と matplotlib が必要です。
import numpy as np
from matplotlib import pyplot as plt


def _steps(x, y):
    int_x = np.round(x)
    ret_x = np.unique(int_x)
    ret_y = []
    for xa in ret_x:
        ret_y.append(np.average(y[int_x == xa]))
    return ret_x, np.array(ret_y)


def plot_scatter(x, returns, normalize=True):
    """
    :param np.ndarray x: 指標
    :param np.ndarray returns: リターン
    :param bool normalize: x をスケーリングするかどうか
    """
    assert(len(x) == len(returns))
    # 正規化
    x = (x - x.mean()) / x.std() if normalize else x
    # 散布図
    plt.plot(x, returns, 'x')
    # 回帰直線
    reg = np.polyfit(x, returns, 1)
    plt.plot(x, np.poly1d(reg)(x), color='c', linewidth=2)
    # 区間平均値
    plt.plot(*_steps(x, returns), drawstyle='steps-mid', color='r', linewidth=2)

    # 相関係数(情報係数)
    ic = np.corrcoef(x, returns)[0, 1]
    plt.title(f'IC={ic:.3f}, y={reg[0]:.3f}x{reg[1]:+.3f}')
    plt.grid()
    plt.show()
plot_scatter の第1引数に指標の1次元配列を、第2引数にリターンの1次元配列を渡します。
if __name__ == '__main__':
    # 平均0、相関係数0.05のサンプルを生成
    mean = np.array([0, 0])
    cov = np.array([
        [1, 0.05],
        [0.05, 1]])
    x, y = np.random.multivariate_normal(mean, cov, 10000).T

    plot_scatter(x, y)
ご覧いただきありがとうございます!