Processing でグラフを描く⑫ 行列による図形の変換

Processing でグラフを描く 第12回目です。
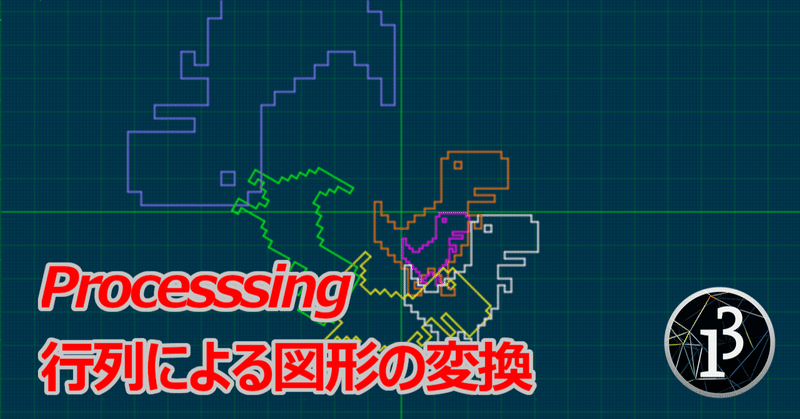
前回「ドット絵をグラフにする」で恐竜のドット絵を Processing で表示するところまでやりました。今回は行列による図形の変換に挑戦します。
学生のころ、線形代数(行列)は意味不明で面白くなかったです。私は理論より実学が好きで、どちらというとエンジニア寄りかと自分では思っています。線形代数も実例とともに学べば理解しやすいし、何より楽しいです。図形の変換は、行列の働きを理解するのに最適かと思います。今回の記事は学生だった頃の私に向けて、行列はこんなに面白いんだよと伝えるつもりで書いていきます。
まずは行列について説明します。
行列
$$
\begin{pmatrix}
a_{11} & a_{12} & \cdots & a_{1n} \\
a_{21} & a_{22} & \cdots & a_{2n} \\
\cdots \\
a_{m1} & a_{m2} & \cdots & a_{mn} \\
\end{pmatrix}
$$
行列とは、数や記号、式などを縦横に並べて表示する方法のことです。なぜ縦横に並べるのかというと、計算上、便利だからです。コンピューターグラフィクスだけでなく、物理学や数学の理論や工学的な利用、最近では機械学習で使用されるなど、広い応用範囲を持っています。
行列は数字と同じように足したり掛けたり計算することが可能です。次に行列の計算について考えていきます。
行列の計算(加算)
$$
\begin{pmatrix}
a_{11} & a_{12} \\
a_{21} & a_{22}
\end{pmatrix}
+
\begin{pmatrix}
b_{11} & b_{12} \\
b_{21} & b_{22}
\end{pmatrix}
=
\begin{pmatrix}
a_{11} + b_{11} & a_{12} + b_{12} \\
a_{21} + b_{21} & a_{22} + b_{22}
\end{pmatrix}
$$
行列の足し算は簡単です。行番号と列番号が同じ要素を足した新しい行列を作成します。足し算は同じ行数、列数を持つ行列同士でないと計算できません。計算式から明らかなように、どちらから足しても同じ答えになります。
行列の計算(乗算)
$$
A =
\begin{pmatrix}
a_{11} & a_{12} \\
a_{21} & a_{22}
\end{pmatrix}\\
B =
\begin{pmatrix}
b_{11} & b_{12} \\
b_{21} & b_{22}
\end{pmatrix}\\
A \times B =
\begin{pmatrix}
a_{11} b_{11} + a_{12} b_{21} & a_{11} b_{12} + a_{12} b_{22} \\
a_{21} b_{11} + a_{22} b_{21} & a_{21} b_{12} + a_{22} b_{22}
\end{pmatrix}
$$
行列の掛け算は少し難しいです。この計算が一体何を表しているかは理解しずらいですが、具体的なイメージを持つことは重要です。
今回の記事の範囲では、行列Bが「座標(またはベクトル)の集まり」と考えます。行列Aが「変換のための行列」であり、掛け合わせることで「変換後の座標(またはベクトル)の集まり」が得られると考えることができます。
行列の掛け算については、行列A の列数と行列B の行数が同じでなければ計算ができません。計算後の行列は「行列Aの行数 x 行列B の列数」のサイズになります。また掛け算の順序を変えると答えが変わってしまう点に注意が必要です。
準備ができましたので、行列による図形の変形を行っていきます。まずは平行移動です。
平行移動
$$
\begin{pmatrix}
x \\
y
\end{pmatrix}
+
\begin{pmatrix}
t_1 \\
t_2
\end{pmatrix}
=
\begin{pmatrix}
x + t_1 \\
y + t_2
\end{pmatrix}
$$
BACKGROUND_COLOR = color(0, 44, 77)
colors = [
    [255, 255, 255],  # white
    [255, 127, 0],  # orange
    [255, 0, 255],  # magenta
    [127, 127, 255],  # lightblue
    [255, 255, 0],  # yellow
    [0, 255, 0],  # lime
    [255, 127, 127],  # pink
    [127, 127, 127],  # gray
    [191, 191, 191],  # lightgray
    [0, 255, 255],  # cyan
    [127, 0, 127],  # purple
    [0, 0, 255],  # blue
    [127, 0, 0],  # brown
    [0, 127, 0],  # green
    [255, 0, 0],  # red
    [0, 0, 0],  # black
]
SIZE = 1200
STEP = 50
SCALE = STEP / 10.0
# 頂点の座標リスト
fig_vertexes = [(23, 1), (39, 1), (21, 3), (23, 3), (25, 4), (27, 4), (39, 3), (41, 3), (25, 6), (27, 6), (31, 12),
                (41, 12), (31, 14), (37, 14), (29, 16), (37, 16), (1, 16), (3, 16), (19, 16), (21, 16), (16, 18),
                (19, 18), (3, 20), (5, 20), (13, 20), (16, 20), (29, 20), (33, 20), (29, 22), (31, 22), (5, 22),
                (7, 22), (11, 22), (13, 22), (31, 24), (33, 24), (7, 24), (11, 24), (1, 28), (3, 28), (27, 29),
                (29, 29), (3, 30), (5, 30), (5, 32), (7, 32), (25, 32), (27, 32), (7, 34), (9, 34), (23, 34), (25, 34),
                (9, 36), (11, 36), (17, 36), (19, 36), (15, 38), (17, 38), (19, 38), (21, 38), (13, 40), (15, 40),
                (13, 42), (15, 42), (23, 42), (25, 42), (11, 44), (15, 44), (21, 44), (25, 44)]
# 手動で頂点をつなぐ順番をリストにする
vertex_orders = [4, 5, 9, 8, 4, 0, 1, 6, 7, 11, 10, 12, 13, 15, 14, 26, 27, 35, 34, 29, 28, 41, 40, 47, 46, 51, 50, 64,
                 65, 69, 68, 59, 58, 55, 54, 57, 56, 61, 60, 62, 63, 67, 66, 53, 52, 49, 48, 45, 44, 43, 42, 39, 38, 16,
                 17, 22, 23, 30, 31, 36, 37, 32, 33, 24, 25, 20, 21, 18, 19, 2, 3, 0]


def setup():
    size(SIZE, SIZE)
    noLoop()


def draw():
    background(BACKGROUND_COLOR)
    for i in range(int(SIZE / STEP)):
        stroke(0, 255, 0, 50)
        line(-2000, i * STEP, 2000, i * STEP)
        line(i * STEP, -2000, i * STEP, 2000)
        for j in range(10):
            stroke(0, 255, 0, 25)
            line(-2000, i * STEP + j * SCALE, 2000, i * STEP + j * SCALE)
            line(i * STEP + j * SCALE, -2000, i * STEP + j * SCALE, 2000)
    pushMatrix()
    translate(width / 2, height / 2)
    noFill()
    stroke(0, 255, 0)
    line(-2000, 0, 2000, 0)
    line(0, -2000, 0, 2000)
    # グラフを描く
    strokeWeight(2)
    # 頂点を線でつなぐ
    for i in range(len(vertex_orders) - 1):
        if i != 4:
            start_end_vectors = [
                [
                    fig_vertexes[vertex_orders[i]][0] * SCALE,
                    fig_vertexes[vertex_orders[i]][1] * SCALE,
                ],
                [
                    fig_vertexes[vertex_orders[(i + 1) % len(vertex_orders)]][0] * SCALE,
                    fig_vertexes[vertex_orders[(i + 1) % len(vertex_orders)]][1] * SCALE,
                ]
            ]
            stroke(colors[0][0], colors[0][1], colors[0][2])
            line_from_vectors(start_end_vectors)
            # 平行移動
            parallel_vectors = [
                matrix_scalar([-9, -19], SCALE),
                matrix_scalar([-9, -19], SCALE),
            ]
            stroke(colors[1][0], colors[1][1], colors[1][2])
            line_from_vectors(matrix_add(start_end_vectors, parallel_vectors))
    popMatrix()


# 始点から終点に線を引く
def line_from_vectors(v):
    line(
        v[0][0],
        v[0][1],
        v[1][0],
        v[1][1],
    )


# 行列をスカラ倍する
def matrix_scalar(a, scalar):
    row_num = len(a)
    new_matrix = []
    if type(a[0]) == list or type(a[0]) == tuple:
        column_num = len(a[0])
        for j in range(row_num):
            new_row = []
            for i in range(column_num):
                new_row.append(a[j][i] * scalar)
            new_matrix.append(new_row)
    else:
        for j in range(row_num):
            new_matrix.append(a[j] * scalar)
    return new_matrix


# 行列の和
def matrix_add(a, b):
    row_num = len(a)
    new_matrix = []
    if type(a[0]) == list or type(a[0]) == tuple:
        column_num = len(a[0])
        for j in range(row_num):
            new_row = []
            for i in range(column_num):
                new_row.append(a[j][i] + b[j][i])
            new_matrix.append(new_row)
    else:
        for j in range(row_num):
            new_matrix.append(a[j] + b[j])
    return new_matrix


# 行列の積
def matrix_mult(a, b):
    row_num = len(a)
    column_num = len(b[0])
    new_matrix = []
    for j in range(row_num):
        new_row = []
        for i in range(column_num):
            sum_value = 0
            for k in range(len(b)):
                sum_value += a[j][k] * b[k][i]
            new_row.append(sum_value)
        new_matrix.append(new_row)
    return new_matrix


# 転換行列にする
def matrix_transpose(a):
    row_num = len(a)
    new_matrix = []
    if type(a[0]) == list or type(a[0]) == tuple:
        column_num = len(a[0])
        for j in range(column_num):
            new_matrix.append([])
            for i in range(row_num):
                new_matrix[j].append(a[i][j])
    else:
        for i in range(row_num):
            new_matrix.append([a[i]])
    return new_matrix


# 拡大縮小
def matrix_zoom(a, scalars):
    row_num = len(a)
    column_num = len(a[0])
    conversion_matrix = []
    for j in range(column_num):
        new_row = []
        for i in range(row_num):
            if i == j:
                new_row.append(scalars[i])
            else:
                new_row.append(0)
        conversion_matrix.append(new_row)
    return matrix_transpose(
        matrix_mult(conversion_matrix, matrix_transpose(a))
    )


# 回転
def matrix_rotate(a, angle):
    conversion_matrix = [
        [cos(angle), -sin(angle)],
        [sin(angle), cos(angle)]
    ]
    return matrix_transpose(
        matrix_mult(conversion_matrix, matrix_transpose(a))
    )


# スキュー(せん断)
def matrix_skew(a, angles):
    conversion_matrix = [
        [1, tan(angles[0])],
        [tan(angles[1]), 1]
    ]
    return matrix_transpose(
        matrix_mult(conversion_matrix, matrix_transpose(a))
    )
平行移動は「行列の和」によって実行されます。
x方向に -9、y方向に -19 すべての頂点を移動しています。Processing は下方向が +y になることに注意が必要です。変数parallel_vector の数字をいじって、いろいろな場所に図形を移動させて遊びましょう。
興味のある方はコードを読み込んでみてください。
簡単に説明すると、matrix_xxx関数は行列関係の処理をまとめたものです。平行移動については、matrix_add関数で座標変換を行っています。拡大縮小、回転、せん断は、それぞれmatrix_zoom、matrix_rotate、matrix_skew関数で処理しています。
matrix_transpose関数は、行列の行と列を入れ替える処理(転換)を行っています。行列の積を計算するとき、転換が必要になる場合があるからです。matrix_transpose関数は、matrix_zoom、matrix_rotate、matrix_skew関数の中で使用されているので使い方を確認しておいてください。
拡大縮小
$$
\begin{pmatrix}s_x & 0 \\ 0 & s_y \end{pmatrix} \times \begin{pmatrix} x \\ y \end{pmatrix} = \begin{pmatrix}s_x x \\ s_y y \end{pmatrix}
$$
# # 平行移動
# parallel_vectors = [
#     matrix_scalar([-9, -19], SCALE),
#     matrix_scalar([-9, -19], SCALE),
# ]
# stroke(colors[1][0], colors[1][1], colors[1][2])
# line_from_vectors(matrix_add(start_end_vectors, parallel_vectors))
# 拡大縮小
scalar1 = [0.5, 0.8]
stroke(colors[2][0], colors[2][1], colors[2][2])
line_from_vectors(matrix_zoom(start_end_vectors, scalar1))
scalar2 = [-2, -2.5]
stroke(colors[3][0], colors[3][1], colors[3][2])
line_from_vectors(matrix_zoom(start_end_vectors, scalar2))
拡大縮小は「行列の積」で実行できます。
変数scalars_x は x方向の倍率、y方向の倍率の二つの値を持ちます。倍率がマイナスになると、原点に対して対称な位置に図形が描かれます。
回転
$$
\begin{pmatrix}cos{\theta} & - sin{\theta} \\ sin{\theta} & cos{\theta} \end{pmatrix} \times \begin{pmatrix} x \\ y \end{pmatrix} = \begin{pmatrix}x cos{\theta} - y sin{\theta} \\ x sin{\theta} + y cos{\theta} \end{pmatrix}
$$
# # 平行移動
# parallel_vectors = [
#     matrix_scalar([-9, -19], SCALE),
#     matrix_scalar([-9, -19], SCALE),
# ]
# stroke(colors[1][0], colors[1][1], colors[1][2])
# line_from_vectors(matrix_add(start_end_vectors, parallel_vectors))
# # 拡大縮小
# scalar1 = [0.5, 0.8]
# stroke(colors[2][0], colors[2][1], colors[2][2])
# line_from_vectors(matrix_zoom(start_end_vectors, scalar1))
# scalar2 = [-2, -2.5]
# stroke(colors[3][0], colors[3][1], colors[3][2])
# line_from_vectors(matrix_zoom(start_end_vectors, scalar2))
# 回転
angle1 = PI / 4
stroke(colors[4][0], colors[4][1], colors[4][2])
line_from_vectors(matrix_rotate(start_end_vectors, angle1))
angle2 = PI * 2 / 3
stroke(colors[5][0], colors[5][1], colors[5][2])
line_from_vectors(matrix_rotate(start_end_vectors, angle2))
回転は「行列の積」によって実行できます。
図形の各頂点に対して、回転行列 $${\begin{pmatrix}cos{\theta} & - sin{\theta} \\ sin{\theta} & cos{\theta} \end{pmatrix}}$$ を掛けて図形を移動させています。Processing は右回りに角度が増えていくことに注意してください。
スキュー(せん断)
$$
\begin{pmatrix}1 & tan{\alpha} \\ tan{\beta} & 1 \end{pmatrix} \times \begin{pmatrix} x \\ y \end{pmatrix} = \begin{pmatrix}x + y tan{\alpha} \\ x tan{\beta} + y \end{pmatrix}
$$
# # 平行移動
# parallel_vectors = [
#     matrix_scalar([-9, -19], SCALE),
#     matrix_scalar([-9, -19], SCALE),
# ]
# stroke(colors[1][0], colors[1][1], colors[1][2])
# line_from_vectors(matrix_add(start_end_vectors, parallel_vectors))
# # 拡大縮小
# scalar1 = [0.5, 0.8]
# stroke(colors[2][0], colors[2][1], colors[2][2])
# line_from_vectors(matrix_zoom(start_end_vectors, scalar1))
# scalar2 = [-2, -2.5]
# stroke(colors[3][0], colors[3][1], colors[3][2])
# line_from_vectors(matrix_zoom(start_end_vectors, scalar2))
# # 回転
# angle1 = PI / 4
# stroke(colors[4][0], colors[4][1], colors[4][2])
# line_from_vectors(matrix_rotate(start_end_vectors, angle1))
# angle2 = PI * 2 / 3
# stroke(colors[5][0], colors[5][1], colors[5][2])
# line_from_vectors(matrix_rotate(start_end_vectors, angle2))
# スキュー(せん断)
angles1 = (PI / 5, 0)
stroke(colors[6][0], colors[6][1], colors[6][2])
line_from_vectors(matrix_skew(start_end_vectors, angles1))
angles2 = (0, PI * 2 / 10)
stroke(colors[7][0], colors[7][1], colors[7][2])
line_from_vectors(matrix_skew(start_end_vectors, angles2))
スキューは図形を斜めに変形させる処理のことです。「行列の積」によって実行できます。
角度$${\alpha}$$ は x方向のせん断、角度$${\beta}$$ は y方向のせん断を指定します。角度を変えて実行することを繰り返して、どのように変形するかをつかんでください。
3次元への適用
ここから3次元図形に行列を適用させていきますが、紙面が尽きたようなので、次回の記事として書かせていただきます。
3次元を理解するためには2次元の理解が基礎となりますので、今回のコードを実際に自分のパソコンで動かしてみてください。数値を色々変えて実行することを繰り返して、図形の変形に慣れておいてくださいね。
この記事で行列が少しでも身近に感じられたとすれば、筆者としてうれしく思います。
前の記事
Processing でグラフを描く⑪ ドット絵をグラフにする
次の記事
Processing でグラフを描く⑬ 行列による3次元グラフの変換
その他のタイトルはこちら
この記事が気に入ったらサポートをしてみませんか?