Spectrum and Cones スペクトルと錐体

Spectral distribution スペクトル分布
光源はそれぞれ異なる波長毎のエネルギー分布を持っていて、この特性を「スペクトル分布」と呼びます。下の絵は異なる光源を比べた例です。白熱電球は蛍光灯やLEDよりも黄色やオレンジがかって見え、熱も発生しますが、グラフを見ると確かに青側よりも赤側の成分やその下の赤外線が多く含まれていることがわかります。
Each light source has its own energy distribution at different wavelengths. This characteristic is called "spectral distribution”. For example, the drawing below compares different kinds of light sources. Incandescent bulbs look more yellowish or orange than fluorescent bulbs or LEDs and generate more heat. The graph shows that they contain more red components and infrared radiation than the blue side.

Obviously, these drawings are not precise. They are only intended to give you a rough idea. 見ての通りこれらの図面は厳密なものではありません。あくまで、大まかなイメージを伝えるためのものです。
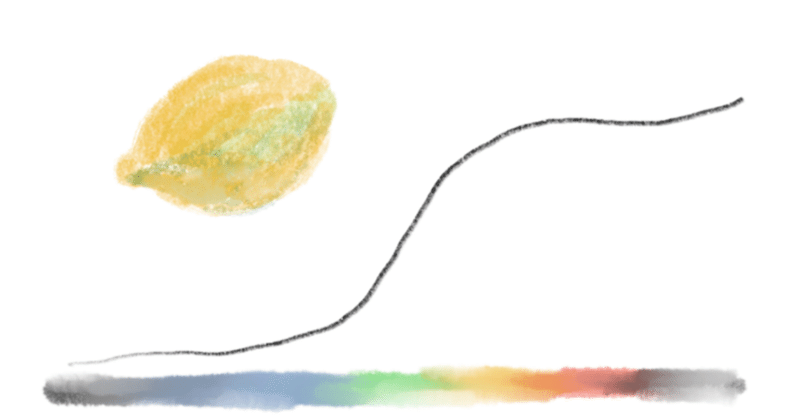
The surface of an object absorbs or reflects different frequencies of light at different rates. For example, the surface of a yellow lemon and red strawberry look like the drawings below.
物体の表面は周波数帯によって異なる割合で光を吸収したり反射したりします。例えば黄色いレモンや赤いイチゴの表面は下の図の様になっています。

Multiplying the light from the source by the reflectance of an object shows what distribution of light is reflected from that object. In the demo below, the yellow line is the spectrum of light and the pink line is the reflectance properties of the object, and the thick white line is the multiplication of the two, which is the actual light reflected.
光源からの光と物体の反射率を掛け合わせると、その物体から反射してくる光がどのような分布を持っているかがわかります。下のデモでは黄色の線が光のスペクトラム、ピンクの線が物体の反射特性、白の太線がこの2つを掛け合わせたもの、つまり実際に反射される光になります。
Cones and light perception 錐体と光の知覚
The human retina that receives the light has photoreceptors called cones. In general, there are three types of cones, each of which is sensitive to different wavelengths of light.
この光を受け止める人間の網膜には、錐体(すいたい)と呼ばれる視細胞(光受容体)があります。錐体には一般的に3種類あり、それぞれ異なる波長の光に高い感度を示します。
Eyes also have cells called rods. Cone cells can respond to colors but are weak in the dark. Rod cells cannot recognize colors but can respond to faint light.
目には桿体という細胞もあります。錐体細胞は色を認識できるが暗いところでは弱く、桿体細胞は色を認識できませんが微弱な光に反応することができます。
The coverage of each of the three types of cones are shown below.
3種類の錐体の守備範囲はそれぞれ下のようになっています。
S-cones (blue cones) short wavelengths
M-cones (green cones) medium wavelength
L-cone (red cones) long wavelength
S錐体(青錐体)短波長
M錐体(緑錐体)中波長
L錐体(赤錐体)長波長
When we perceive light, the color is determined by the balance of stimuli to these three types of cones. Notice that the information is considerably reduced from the spectral distribution to just three values. For example, the spectral distributions of LED and fluorescent light above are quite different, but because the stimulation to the cones is similar, they appear to be similar white light to us. The actual spectrum cannot be recovered from the color information perceived by humans.
人間が光を知覚する時はこの3種類の錐体への刺激のバランスによって色が決まるわけです。スペクトル分布から3つの値へとかなり情報が減衰されています。例えば上のLEDと蛍光灯の分光分布はかなり異なった形をしていますが、錐体への刺激が似ているので人間には同じような白い光に見えます。人間が知覚した色の情報から実際のスペクトラムを復元することはできません。
This may seem to explain why monitors express colors in RGB, but historically the order was opposite: Maxwell formulated Young-Helmholtz's trichromatic theory in 1857, CIE RGB which we will touch upon briefly in the next section was established in 1931, and the details of cone reactions were discovered in the 1960s to 80s.
これを見るとモニタがRGBで色を表現するのも納得できる気がしますが歴史的には順番が逆で、ヤング=ヘルムホルツの三色説をマクスウェルが定式化したのが1857年、次に触れるCIE RGBが制定されたのが1931年、錐体の反応について詳しくわかったのは60-80年代のようです。
The figure above also shows that the ranges of M- and L-cones overlap a lot. Since the RGB frequencies of a typical display are like in the table below, the red light in particular does not simply correspond to the L-cones.
また上の図からはM錐体とL錐体の範囲がかなり重なっていることが見て取れます。一般的なディスプレイのRGBの周波数は下の表の通りなので、特に赤の光とL錐体はうまく対応していないことが分かります。
Blue (0, 0, 1) approximately 450nm
Green (0, 1, 0) approximately 550nm
Red (1, 0, 0) approximately 700nm
This is a copy from kyndinfo.notion.site. Here's the original page.
このページはkyndinfo.notion.site からの転載です。元のページはこちら。
この記事が気に入ったらサポートをしてみませんか?