フットボール統計学 シュート後のモデルである枠内xGを使ってシュートの質やGKのパフォーマンスを評価する

BLOG: Introducing expected goals on target (xGOT)
12.03.19
Jonny Whitmore
Key takeaways
– xG is a pre-shot model, whereas xGOT is a post-shot model.
– At shooter level, we can better understand if goalscoring has been down to good finishing over a sustained period or as a result poor goalkeeping.
– Goalkeeper performance can be better understood when comparing goals to xGOT faced.
- xGはシュート前のモデルだが、枠内xGはシュート後のモデルである。
- シューターのレベルでは、得点奪取が長期間にわたって良好な結果を得ているか、またはその結果としてゴールキーピングが不十分であるかをよりよく理解できる。
- ゴールを枠内xGと比較すると、ゴールキーパーのパフォーマンスがよく理解できる。
Following on from our Expected Goals (xG) model, we have developed a separate model for Expected Goals on Target (xGOT). This model builds upon the original xG model by crediting on-target shots based on a combination of their underlying chance quality (xG) and the quality of their execution.
xGモデルに続いて、枠内xG用に別のモデルを開発した。このモデルは、基礎となるチャンスの質(xG)とその実行の質の組み合わせに基づいて枠内シュートを評価することで、元のxGモデルを基にしている。
xG measures the quality of the chances that a side makes and xGOT builds on this to tells us what a team managed to do with these chances. Essentially, xG is a pre-shot model while xGOT is a post-shot model.
xGは、チームが作るチャンスの質を測定し、枠内xGはこれを基にして、チームがこれらのチャンスに対して何をしたかを教える。基本的に、xGはシュート前のモデルであり、枠内xGはシュート後のモデルである。
The Expected Goals on Target model is built on historical on-target shots and includes the original xG of the shot but also the goalmouth location where the shot ended up. It gives more credit to shots that end up in the corners compared with shots that go straight down the middle of the goal. This model is only for on-target shots given that if you don’t get your shot on target, there’s a 0% chance that it will result in a goal.
枠内xGモデルは、過去の枠内シュートに基づいて構築されており、シュートの元のxGだけでなく、シュートが終了したゴールマウス位置も含まれる。それはゴールの真ん中にまっすぐに行くシュートと比較して隅に行くシュートに多くの評価を与える。このモデルは、枠内へ飛ばなかった場合、得点奪取の確率が0%のため、枠内シュートのみを対象とする。
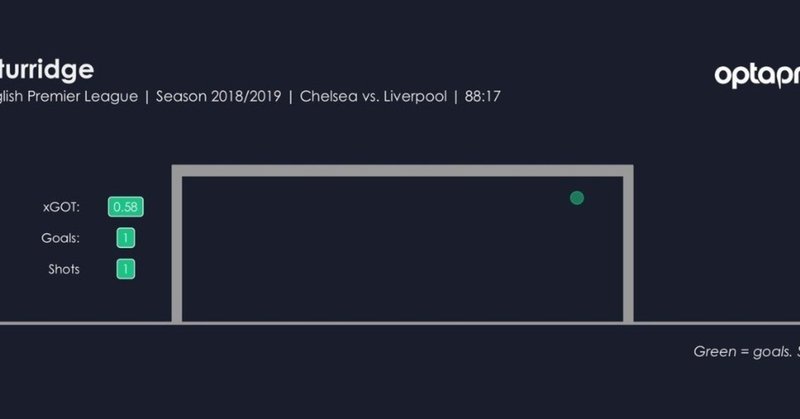
Let’s look at an example. Below we can see Daniel Sturridge’s late equaliser for Liverpool against his former club Chelsea, early in the 2018/19 Premier League season.
例を見る。下は2018/19プレミアリーグシーズン序盤、リバプールのダニエル・スタリッジが古巣チェルシーと対戦した時の同点弾である。
Sensational Studge 💥@LFC's @DanielSturridge wins the @Carling #PL Goal of the Month award for September with this piece of genius...#PLAwards pic.twitter.com/GD3K4sYi1V
— Premier League (@premierleague) October 12, 2018
Sturridge’s shot was assigned an xG value of 0.03. Given that his shot was taken from more than 27 metres out, the pre-shot chance quality measure is relatively low here. However, in our post-shot xGOT model, we will also account for the finishing location of his shot in the goal.
スタリッジのシュートには0.03のxG値が割り当てられる。彼のシュートが27メートル以上離れたところから放たれており、ここではシュート前のチャンスの質の尺度は比較的低い。
ただし、シュート後の枠内xGモデルでは、ゴール内のシュートの終了位置も考慮する。
In the graphic below, we can see the goalmouth location for this shot:
下図で、このシュートのゴールマウスの位置を確認できる。
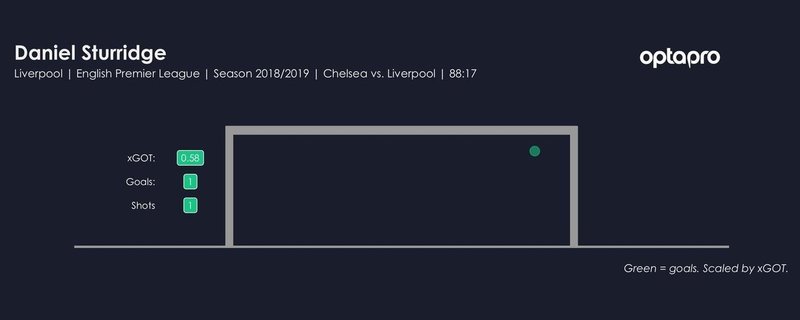
Sturridge’s shot went into the top right corner of the goal, making it incredibly hard to save. Consequently, despite the difficulty of the chance, the high quality of Sturridge’s shot is reflected in the post-shot xGOT model and his shot is assigned an xGOT value of 0.58.
スタリッジのシュートはゴール右上隅に突入したため、セーブするのが非常に困難だった。その結果、チャンスの難しさにもかかわらず、スタリッジの高品質のシュートはシュート後の枠内xGモデルに反映され、枠内xG値0.58が割り当てられる。
Quantifying finishing ability
We can use these xGOT values as an indicator, over a given time period, for how well a player is shooting. For example, a player whose xGOT is exceeding their xG is executing better quality shots, given the quality of chances he has attempted shots from. We call this difference between xGOT and xG, Shooting Goals Added (or SGA).
これらの枠内xG値は、選手がどれだけ上手くシュートするかの指標として、一定期間にわたって使うことができる。例えば、枠内xGがxGを上回っている選手は、シュートを試みたチャンスの質を考えると、より質の高いシュートを実行している。枠内xGとxGの間のこの違いをシュート得点追加(SGA)と呼ぶ。
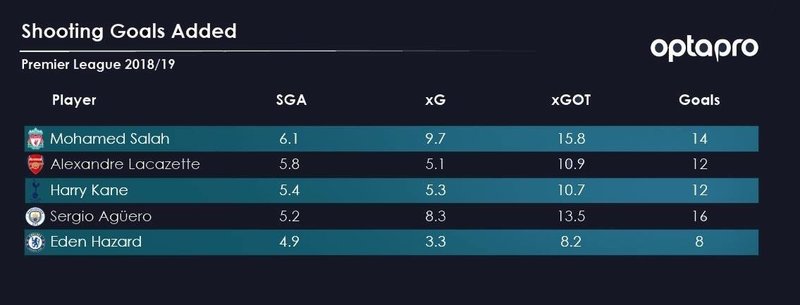
*Excluding penalties and blocked shots
※ペナルティーとブロックされたシュートを除く
In the table above, we can see the top 5 Premier League players this season in terms of SGA. Perhaps one of the most notable names on the list is Eden Hazard, who has scored 8 goals for Chelsea so far this season with a comparatively low xG of 3.3. You can clearly see that he is outperforming the quality of his chances. With an xGOT value of 8.2, we can now credit this difference to the quality of his finishing.
上の表では、SGAに関して今シーズンのプレミアリーグの上位5選手を見られる。おそらくリストの中で最も注目に値する名前の1つはエデン・アザールで、今シーズンこれまでのところxGは3.3と比較的低いがチェルシーで8得点を決めている。彼がチャンスの質を凌駕していることをはっきりと見られる。枠内xGの値が8.2なので、この違いを彼のフィニッシュの質と見なすことができる。
This impressive shooting so far this season has improved the quality of Hazard’s pre-shot chances by 4.9 goals. This indicates that, from his given chances, he is both getting his shots on target and hitting them in good locations.
今シーズンの印象的なシュートはこれまでのところ、アザールのシュート前のチャンスの質を4.9ゴール向上させた。これは彼のチャンスから、彼はシュートを枠内に飛ばし、そして良い位置へ蹴り込んでいることを示す。
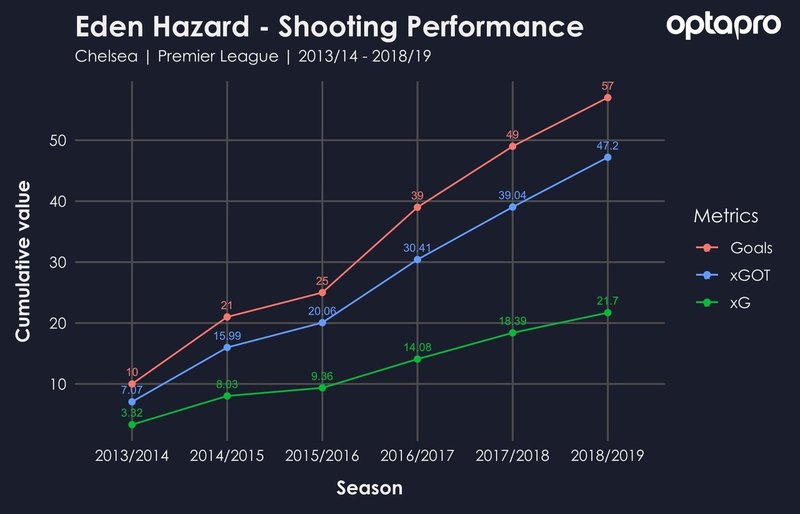
In fact, by analysing Eden Hazard’s cumulative xG and xGOT values in the graph below, we can see that Hazard’s remarkable shooting ability has seen him consistently outperform the underlying quality of his given chances in each of the last six Premier League seasons.
実際、下のグラフでエデン・アザールの累積xGおよび枠内xGOTの値を分析することで、アザールの顕著なシュート能力が過去6年のプレミアリーグの各シーズンにおいて与えられたチャンスの根本的な質を常に上回っているのがわかる。
Measuring goalkeeper performance
Another use of xGOT is as a tool for analysing goalkeeper performances. We can use it to highlight the goalkeepers who have under-conceded considering the quality of the shots on target they’ve faced. This can be seen by calculating the number of goals prevented (calculated as xGOT conceded from shots on target faced, minus goals conceded).
枠内xGの別の用途は、ゴールキーパーのパフォーマンスを分析するためのツールとしてである。直面している枠内シュートの質を考慮して失点が少ないゴールキーパーを強調するために使える。これは、得点防御数を計算することによって見られる(被枠内xGから失点を引いたものとして計算される)。
This metric allows us to distinguish between the goalkeepers who are making high quality saves and those whose save counts may have been inflated by easy, low quality shots.
この指標により、高品質のセーブを行っているゴールキーパーと、簡単で低品質のシュートによってセーブ数が膨らんでいる可能性があるゴールキーパーとを区別することができる。
Let’s compare David De Gea’s Premier League golden glove winning season in 2017/18 with his performances so far in the league this season:
ダビド・デ・ヘアの、プレミアリーグのゴールデングローブ受賞の2017/18シーズンと、今シーズンのこれまでのリーグでのパフォーマンスとを比較してみる。
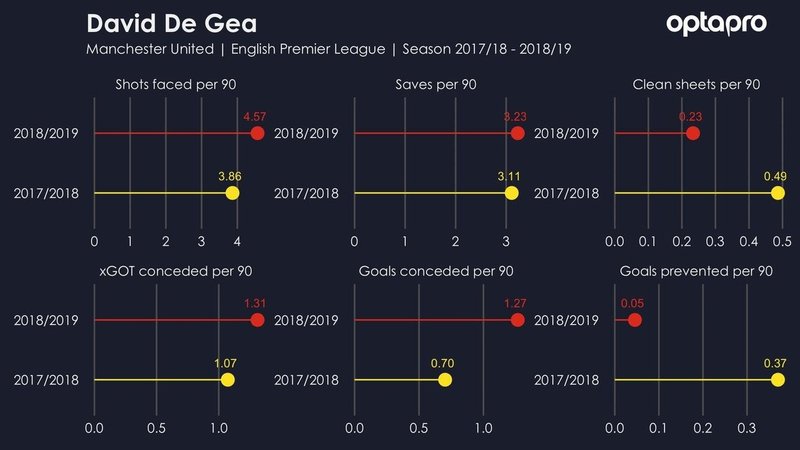
De Gea kept a remarkable 18 clean sheets last season, the most in the Premier League since 2012/13. He conceded 28 goals, but the quality of the on-target shots he faced, according to xGOT, was enough to concede nearly 40 goals (39.7). De Gea, therefore, was responsible for his side conceding nearly 12 fewer goals than the average ‘keeper would have, at a rate of nearly one every three games.
デ・ヘアは昨シーズン、注目に値する18回のクリーンシートを達成し、これは2012/13年以来プレミアリーグで最も多かった。彼は28失点したが、枠内xGによると、彼が直面した枠内シュートの質は40失点近くだった(39.7)。したがってデ・ヘアは12失点分近く、平均的なゴールキーパーなら3試合に1失点分、チームに責任を負っていた。
This season has been a different story. De Gea has conceded 12 more goals than he did last season and he has achieved this unfortunate feat with 8 league games remaining. You may say that Manchester United’s defenders haven’t helped him out, with De Gea facing 4.6 shots per 90 minutes compared with 3.9 last season.
今シーズンは別の話になった。デ・ヘアは昨シーズンより12失点多く、8試合を残してこの残念な成績を達成した。デ・ヘアは90分あたり昨シーズンの3.9本と比較して4.6本シュートに直面しており、マンチェスター・ユナイテッドの守備陣が彼を助けていないと言うかもしれない。
However, despite matching this with an increase in saves per 90 minutes, it was only after improved performances under new manager, Ole Gunnar Solskjaer, that De Gea has actually been attributed with a positive goals prevented value over 2018/19. De Gea has now conceded 38 goals while, according to xGOT, the quality of the on-target shots he faced suggested he should have conceded just over 39 goals.
しかし、これが90分あたりのセーブの増加と一致したにもかかわらず、デ・ヘアが実際に2018/19年で正の得点防御値とされたのは、新しい指揮官オーレ・グンナー・スールシャールの下でのパフォーマンス向上の後だった。枠内xGによると、彼が直面した枠内シュートの質は39失点をわずかに超えるべきだと示唆していたが、デ・ヘアは今38失点である。
Although this isn’t particularly a cause for concern, unfortunately for Manchester United it appears that De Gea hasn’t sustained his superhuman form from 2017/18 and has regressed to normality.
これは特に心配の種ではないが、残念ながらマンチェスター・ユナイテッドにとって、デ・ヘアは2017/18年の超人的な形を維持しておらず、正規に後退している。
We can see a graphical representation of De Gea’s performances, using xGOT, over the last six Premier League seasons below:
以下の過去6年のプレミアリーグでの枠内xGを使用したデ・ヘアのパフォーマンスの図表表示を見る。
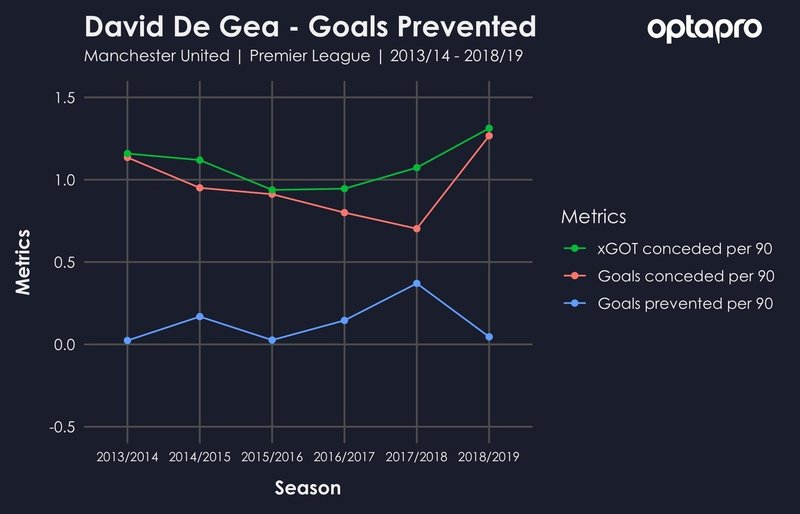
While De Gea has over-performed in a few campaigns (with a positive goals prevented per 90 minutes played) he has tended to regress back towards zero in the subsequent season. So it appears that it may be difficult for a goalkeeper to maintain over-performance over a long period of time.
デ・ヘアは数シーズン過剰なパフォーマンスを見せたが(90分あたり正の得点防御)、次のシーズンにゼロに向かって後退する傾向にあった。そのため、ゴールキーパーが長期間にわたって過剰なパフォーマンスを維持することは困難である可能性がある。
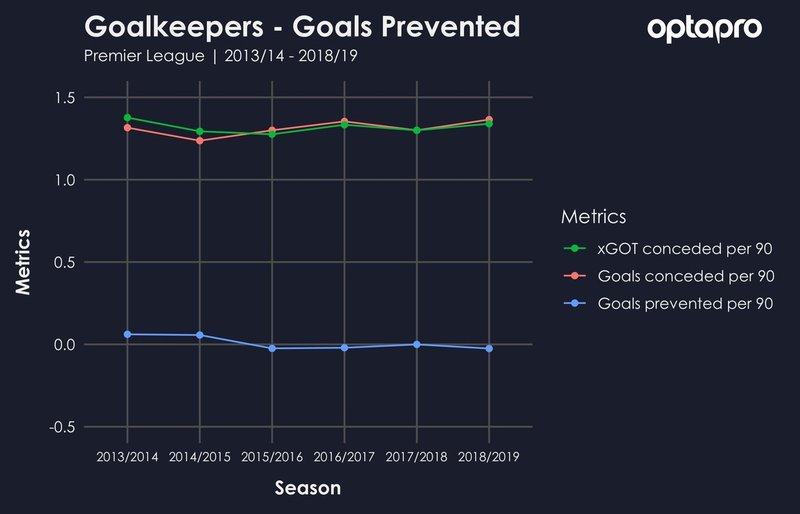
This is evidenced when we look at the graph for the combined performances of all Premier League goalkeepers over the same time period below. We can see that they consistently conceded in line with what they were expected to concede, given the quality of the shots on target they faced. Over these six seasons, they were, according to xGOT, expected to concede 5807 goals and conceded only 40 less than this in reality.
これは、以下の同じ期間におけるプレミアリーグのすべてのゴールキーパーの総合パフォーマンスのグラフを見ると明らかである。直面している枠内シュートの質を考えると、失点期待値と一致して一貫して失点しているいることがわかる。枠内xGによると、これら6シーズンで、5807失点と予想され、実際にはこれより40だけ少なかった。
Using xGOT in this way allows us to give specific credit to goalkeepers for their performances, whereas more traditional measures such as clean sheets may be biased by team form or defensive strengths.
このように枠内xGを使用することで、ゴールキーパーのパフォーマンスに特定の評価を与えられる一方、クリーンシートなどのより伝統的な方法は、チーム形式や守備力によって偏る可能性がある。
ここから先は
¥ 100
#フットボール統計学